
SDSS allows astronomers to be able to find the norm with regard to many astronomical objects. Finding the norm is extremely important. Astronomy is physics and physics forces everything to happen in a certain way. And for things that are persistent and take a very long time, the physics is compelling. Stars form. They evolve over billions of years. They die. It is a very repeatable process. So you have to know the norm before you understand which things are outliers, that is which things are unusual. So with a sample hundred objects, you may have only found the very brightest objects.
The first quasar discovered was found to be of 13th magnitude, among the brightest few in the sky. The faintest star you can see in the sky is 6th magnitude; so the 13th magnitude is 600 times fainter than the faintest star you can see with your eye, but that is 100 times brighter than most quasars. It was the closest one to the Earth that was known until SDSS came along. That’s a very unusual event; it’s one of the brightest quasars and, though it is 2.4 billion light years away, it is essentailly next to Earth on the cosmic scale. And its not typical by any means. To find a normal quasar we need a much larger sample to determine the average properties of quasars throughout the Universe.

SDSS Quasar Spectrum: The spectrum of a quasar at a redshift (z) of 4.16. The Survey will obtain spectra for roughly 100,000 quasars, although most will be at lower redshift than this one.
Credit: Brian Wilhite / SDSS
Even when finding a huge number of quasars, you are still missing the quasars that are occluded with dust because dust absorbs the optical radiation so they are not so noticible. However, the same dust is not as effective in blocking the infrared photons. Astronomers are starting to find new quasars by comparing SDSS to an infrared survey known as 2MASS. The new quasars of interest will be bright in the infrared and faint in the optical. You still need the optical to identify these quasars even though they are not bright enough that you would have chosen to look at it as a quasar before. Once you know it is a bright infrared source, you know it is worth looking at.
Now the small number of observable occluded quasars are starting to be found; a few hundred of those would come out of the millions of galaxies. They are not normal, but they are very important. From these quasars, scientists are refining their original question about quasars: How are quasars created? The question could have been asked historically, but SDSS has provided a a wealth of new information about the observable aspects of quasars so the question of origins can now be refined. Almost all questions have or could have been asked by someone at some time, probably decades ago, so the big question is: When is the question asked in a context that you can actually predict something, and build equipment that will get an answer?
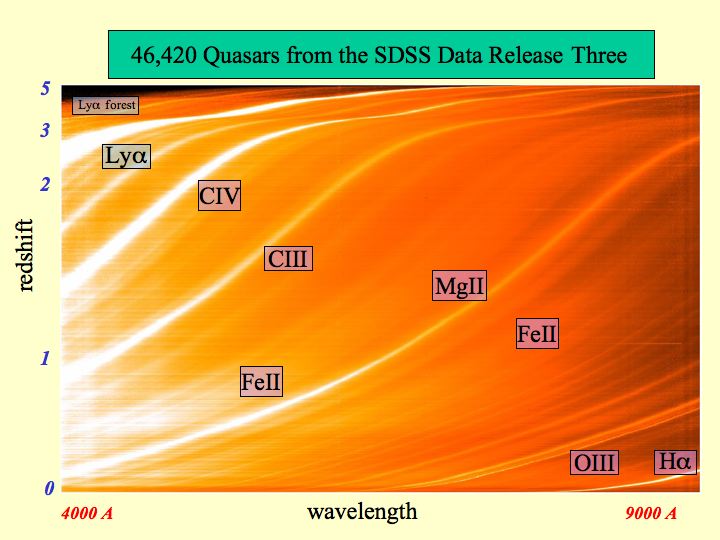
46,420 Quasars from SDSS: In addition to images, the SDSS has measured the spectra of light from more than a million celestial sources. The spectrum of an object shows the intensity of its light as a function of wavelength. This picture shows the spectra of more than 46,000 quasars from the SDSS 3rd data release; each spectrum has been converted to a single horizontal line, and they are stacked one above the other with the closest quasars at the bottom and the most distant quasars at the top. Bright bands show the emission produced by specific ions of hydrogen, carbon, oxygen, magnesium, and iron. For more distant quasars, these emission lines are shifted to longer wavelengths by the expansion of the Universe. This redshift of spectral lines is what the SDSS measures to determine the distances to quasars and galaxies.
Credit: X. Fan and the Sloan Digital Sky Survey
