
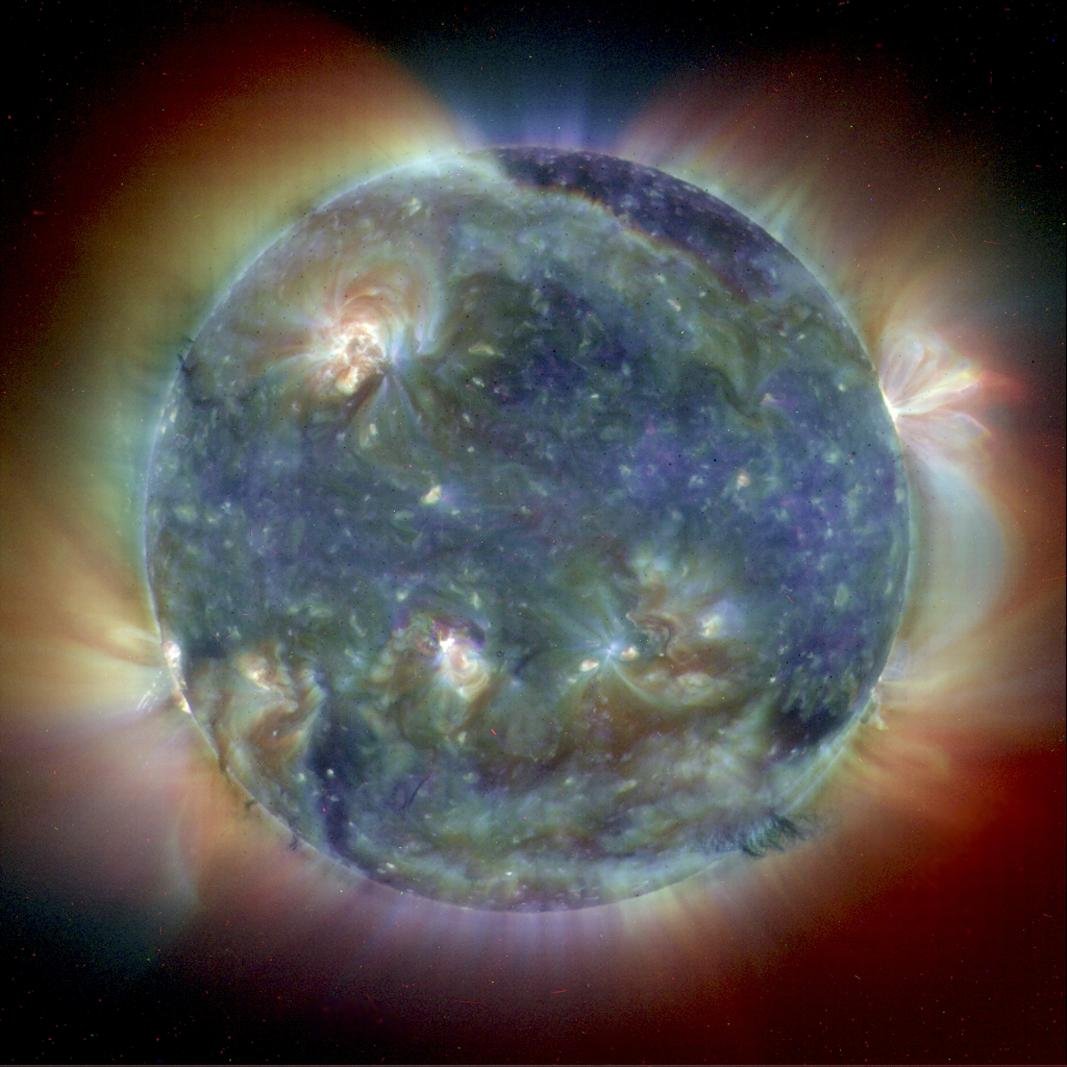
Extreme Ultraviolet Sun: This composite Solar and Heliospheric Observatory (SOHO) image combines Extreme Ultraviolet Imaging Telescope (EIT) images from three wavelengths into one that reveals solar features unique to each wavelength. Since the EIT images come to us from the spacecraft in black and white, they are color coded for easy identification. For this image, the nearly simultaneous images from May 1998 were each given a color code (red, yellow and blue) and merged into one.
Credit: ESA / NASA
Fifty years ago we didn’t know how much ultraviolet radiation was coming from stars. People thought they knew, but there was no proof. When we first started flying rockets and measuring that radiation, we started to get an idea of whether or not these models were correct. It turned out that they were pretty good, but not completely on the money. Since then, we’ve used the ultraviolet to explore the gas between the stars, to observe the high-velocity winds blowing off of stars as they evolve, to look at star quakes, and to study volcanoes on Jupiter’s moon, Io, which spews sulfur into the region around it and then it glows in the ultraviolet. These are only a few examples of the science with which I have been involved.
The ultraviolet spectral region is being used to study the Universe on an even grander scale. I am speaking of the origin of the elements and the study of intergalactic gas. It is now understood that the natural elements of the periodic table are created in the explosions of massive stars called supernovae. It is the radiation from these massive stars before they explode for which the use of the ultraviolet is the most advantageous approach. Using the ultraviolet on the nearest galaxies, we can understand how many hot stars are formed each year, and therefore understand the ultimate input of elements from the supernovae explosions into space.
We also use the ultraviolet spectral region to look at distant quasars, and then we analyze the light from these quasars. We can measure the intergalactic gases between the quasars, which contain the oldest, most pristine gas in the Universe.

Jupiter's Volcanic Moon Io: Jupiter's moon Io with the plume of a volcano visible in green at center right in this false color image. Measurements at two ultraviolet wavelengths indicate the plume consists of sulfur dioxide.
Credit: J. Spencer (Lowell Observatory) and NASA/ESA/STScI
