What We Learn from Hubble

Image of Edwin G. HubbleHubble's position above Earth's atmosphere and its instruments used for making a variety of observations have given us a clear, new understanding of the Universe. This lesson presents an overview of the scientific instruments on board the Hubble Space Telescope and what what we learn from them.

The Big Bang

In January 1995, astronomers aimed the Hubble Space Telescope (HST) at the planet, Venus. The spectrograph inside the HST separated light waves into colors and lines. Astronomers and other scientists used these colors and lines to find out what gases make up Venus's atmosphere.

Maybe you are wondering, How can you look at a colored line and tell what a planet is made of?

The expansion of the Universe began with an event called the Big Bang 13.8 billion years ago. In a fraction of a second, the Universe expanded into a very large, very hot mass of sub-nuclear particles, electrons, and photons. The infinite darkness was suddenly filled with matter and motion. This event happened so quickly and with such power that only traces of what occurred are still there. Among those traces were hydrogen, helium, and deuterium, swirling in a searing, blistering maelstrom of heat.

Within a million years, in a cooling fury, the hydrogen and helium combined with electrons that were also present. These atoms began to circulate and clump together into whirling masses that eventually took shape as galaxies. Over the next 500 million years stars formed, and in a series of "little bangs," the first traces of elements heavier than helium came into being.


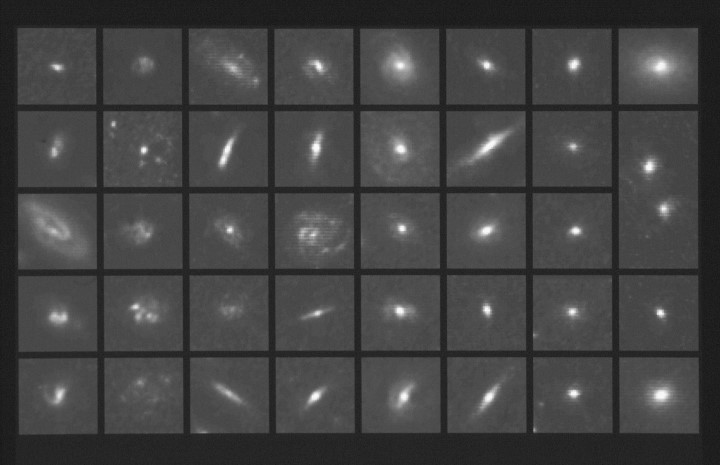
Hubble Atlas of Ancient Galaxies

Hubble Atlas of Ancient Galaxies

The Hubble Space Telescope (HST) allows astronomers to study, for the first time, the shapes of galaxies which existed four billion years ago, when the Universe was two- thirds of its present age. HST pictures are sharp enough to distinguish between various forms of spiral galaxies, as well as galaxies in collision, some tearing material from each other, some merging into single systems.

The galaxies in this atlas are arranged according to their distance, shape, size, and brightness, a system that was developed by Edwin Hubble in the 1920s. The top three rows show familiar types of galaxies which are found today in nearby clusters: elliptical galaxies and lens-shaped galaxies. Rows 4 through 7 show spiral galaxies categorized by the openness of their pinwheel-shaped arms. The bottom row shows galaxies apparently merging into single systems.

Credit: Alan Dressier, Carnegie Institution, and NASA Co-investigators Augustus Oemler (Yale University), James E. Gunn (Princeton University), Harvey Butcher (the Netherlands Foundation for Research in Astronomy)

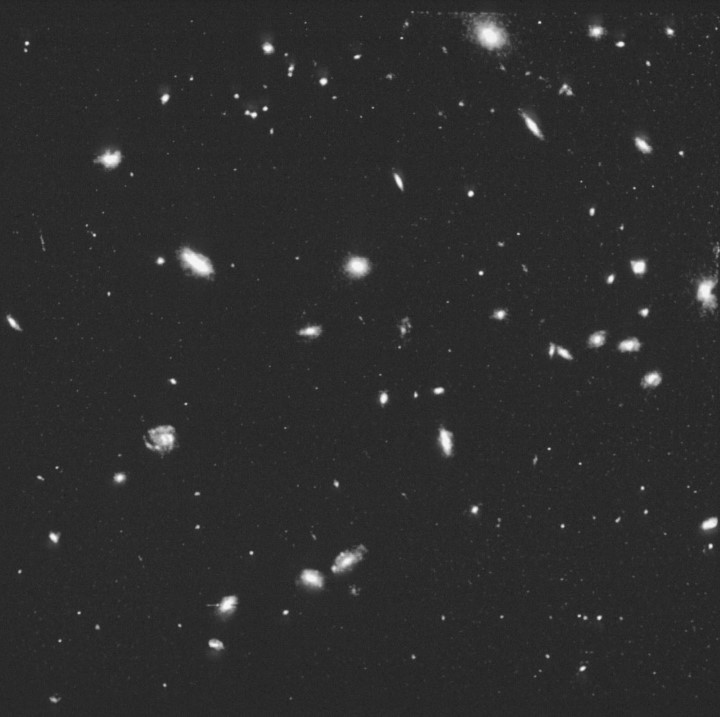
Cluster of Galaxies Four Billion Light-Years Away

Cluster of Galaxies Four Billion Light-Years Away

Looking far away and far back in time, the Hubble Space Telescope found some ancestors of today's galaxies. This Hubble picture reveals that star-forming galaxies were far more common in the clusters of the younger Universe than in modern clusters of galaxies near us today. These results are important for theories of how galaxies have evolved since the beginning of the Universe.

Credit: Alan Dressier, Carnegie Institution, and NASA Co-investigators Augustus Oemler (Yale University), James E. Gunn (Princeton University), Harvey Butcher (the Netherlands Foundation for Research in Astronomy)

Light Tells the Story

In one of the 100 billion galaxies that eventually formed, billions and billions of stars began to shine. About 5 billion years ago a group of planets united around at least one star to form a system. One of those planets is the one that we live on.

As of 2014, we know there are 500 solar systems—stars with planets in orbit around them—in the observable Universe, and we presume there are many, many more waiting to be found. Sorry, no pictures, no historical records, no eyewitness news footage. What we do have is light. And understanding light will guide us toward understanding how the Universe began.

Light tells the story of creation. The trail of light carries most of the information we will ever have about the beginnings of the Universe. The Hubble Space Telescope was built to investigate that light.

Hubble Space Telescope

Hubble Space Telescope

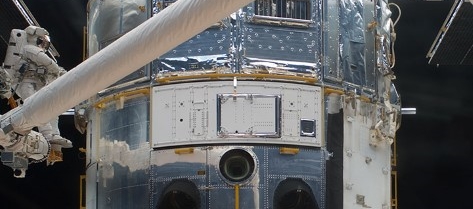
The Hubble Space Telescope's launch in 1990 sped humanity to one of its greatest advances in that journey. Hubble is a telescope that orbits Earth. Its position above the atmosphere, which distorts and blocks the light that reaches our planet, gives it a view of the universe that typically far surpasses that of ground-based telescopes.

Credit: NASA and Space Telescope Science Institute (STScI)

Imagine a ray of light coming from an early galaxy 10 billion years ago. The light leaves the star that produced it and heads toward Earth. It travels through interstellar gases (the matter between the stars in a galaxy). As it travels through the galaxy, the light is affected by the atoms in the gas and loses some of its sub-nuclear particle. Then it leaves that galaxy and enters the vacuum of intergalactic space, where it encounters an object with a strong gravitational force and is bent on its path. Or it might enter a cloud of dust left over from star formation and never be seen again. However, most everything that leaves a galaxy and is aimed at Earth eventually gets here.

Finally that light finds an eye, a telescope, or a camera on Earth. The light we see from the most distant objects actually started out when the Universe was very young. Looking at the stars is looking back in time, seeing the Universe as it was when the light left the star, not as it is now.

Colors of the Spectrum

So what does the Hubble Space Telescope tell us about light? Well, several things. Remember, when Sir Isaac Newton first watched rays of light travel through a glass prism, he saw them emerge not as white light but as bands of color. This happens because light bends when it travels from one material (air) into another (glass). Each color bends a different amount.

Each color of the visible light spectrum has its own unique amount of energy. When this energy arrives in a detector, it is counted as a unique event called a photon. It is the different amounts of energy of these photons that give light its colors.

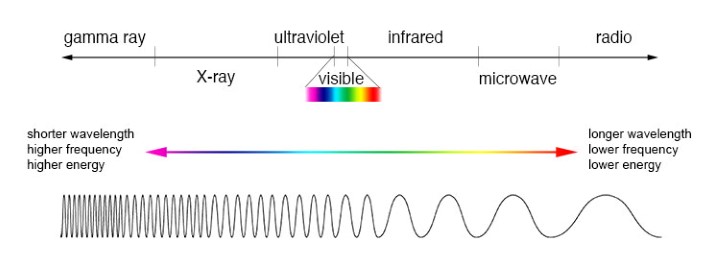
Each color in the visible light spectrum has a different wavelength. Red has the longest wavelength and lowest energy, and violet the shortest wavelength and highest energy.

Measuring Electromagnetic Radiation

Measuring Electromagnetic Radiation

The electromagnetic spectrum represents the complete range of electromagnetic radiation. The region of the spectrum with a shorter wavelength than the color violet is referred as ultraviolet radiation, and the region of the spectrum with a longer wavelength than the color red is referred to as infrared radiation.

Credit: High Energy Astrophysics Science Archive Research Center (HEASARC) at NASA’s Goddard Space Flight Center

Visible light can be divided into thousands of segments that carry information about light. The way visible light is emitted or absorbed by matter, and how it reacts as it travels through space, generates changes in the segments of the spectrum. It is these changes that tell us about how and when stars were made.

Think about what color tells us about our everyday life. Green leaves signify the middle months in a year and tell us a tree is healthy. Reddish-brown rust on a car lets us estimate its age. All the segments of all the colors are the spectra. The instrument that astronomers use to split the color into segments is called a spectrograph.

Visible light is only a portion of the electromagnetic spectrum. Even if an object isn't hot enough to give off visible light, it can still emit a lot of its energy in the infrared part of the spectrum. For example, hot charcoal may not give off light but it does emit infrared radiation that we feel as heat.

Star Clusters Viewed in Multiple Wavelengths

Star Clusters Viewed in Multiple Wavelengths

Celestial bodies emit light in a variety of wavelengths, from gamma rays to radio waves. This picture shows multiple images of a ring of star clusters that surround the core of the galaxy called NGC 1512. Each of the images represents a specific temperature (color) and wavelength region of the spectrum, from ultraviolet to near infrared, detected by instruments on the Hubble Space Telescope.

Credit: NASA, ESA, and D. Maoz (Tel-Aviv University and Columbia University).

Temperatures of Colors

In the early 1800s, Sir William Herschel, who later discovered the planet Uranus, devised an experiment to measure the temperature of each color of the spectrum. He sent sunlight through a glass prism to create a spectrum, and then placed a thermometer in each color. Two more thermometers were placed beyond the spectrum as control samples.

Herschel measured the temperatures of the violet, blue, green, yellow, orange, and red light, and noticed that all of the colors had temperatures higher than the control samples. He also noticed that the temperatures increased from the violet, through yellow, to the red part of the spectrum. After noticing this pattern, Herschel wondered what was beyond the red portion of the spectrum. He moved a thermometer just beyond the visible red, and to his surprise, found that this region had the highest temperature of all.

Herschel could not explain the increase in temperature in the colors of the spectrum because it was an effect of the energy spectrum of the Sun, the details of which were not understood for another 80 years. But his experiment was very important because it led to the discovery of infrared and demonstrated for the first time that there were forms of light that we cannot see with our eyes.

Uranus in Infrared

Uranus in Infrared

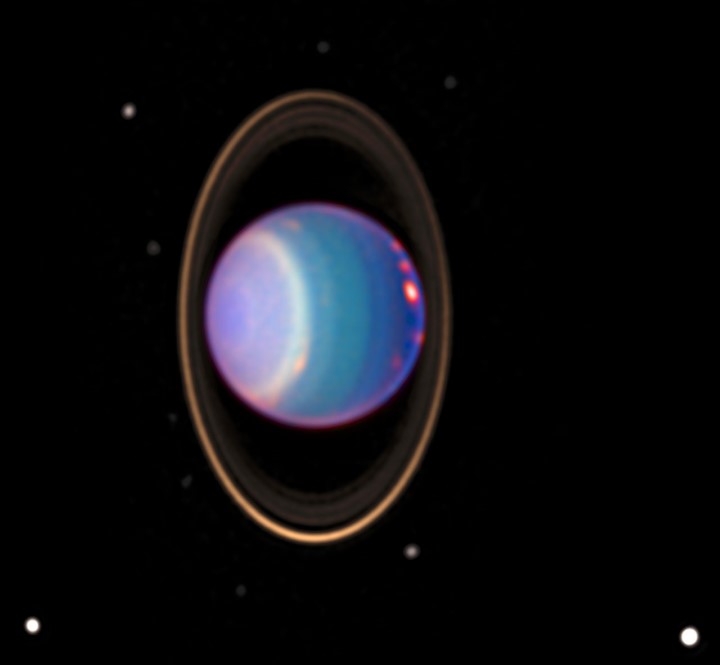
This image of the planet Uranus was taken by the NICMOS instrument on the Hubble Space Telescope. NICMOS stands for Near Infrared Camera and Multi-Object Spectrometer. It was designed to detect objects in the near-infrared wavelengths. However, because the human eye cannot see infrared light, “false colors” were used to produce an image of Uranus. Using false colors helps bring out subtle details, for example, the rings of Uranus are extremely faint in visible light but quite prominent in the near infrared.

Credit: NASA/JPL/STScI

Questions

How might we use infrared images to look for signs of life?

From Ultraviolet to Infrared

Past the color violet is the ultraviolet region of the spectrum. Ultraviolet waves are the ones responsible for giving us sunburns. Earth's ozone filters out most of the ultraviolet radiation, which is good for humans but bad for scientific investigation.

Saturn's Ultraviolet Aurora

Saturn's Ultraviolet Aurora

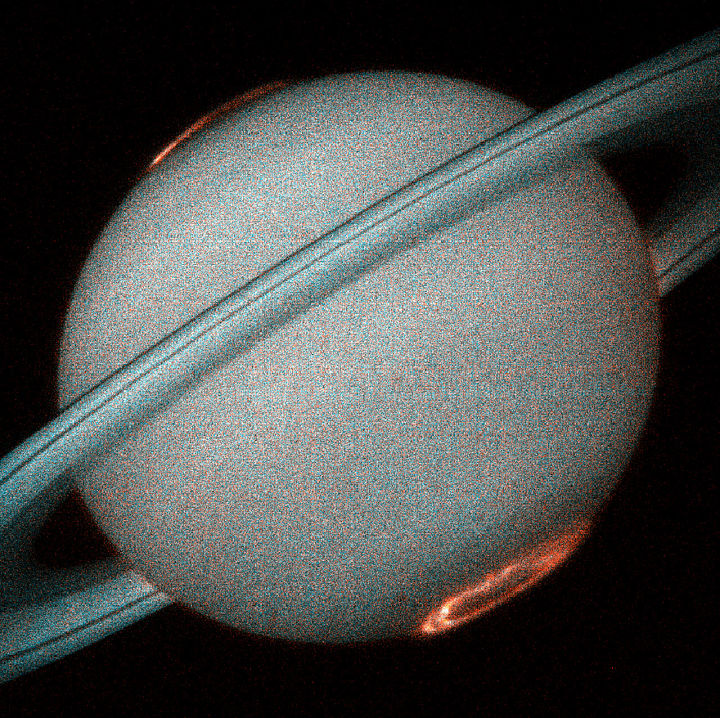
This image of Saturn's ultraviolet aurora was taken by the Space Telescope Imaging Spectrograph (STIS) on board the Hubble Space Telescope. Saturn's auroral displays are caused by an energetic wind from the Sun that sweeps over the planet, much like the Earth's aurora that is occasionally seen in the nighttime sky and similar to the phenomenon that causes fluorescent lamps to glow. But unlike the Earth, Saturn's aurora is only seen in ultraviolet light that is invisible from the Earth's surface, thus, it can only be observed from space.

Credit: J.T. Trauger (Jet Propulsion Laboratory) and NASA/ESA

In the early 1800s Johann Ritter was experimenting with silver chloride, which turns black when exposed to light. He was looking to see how silver chloride reacted to the different colors of the visible light spectrum. He directed sunlight through a glass prism to create a spectrum and then placed silver chloride in each color of the spectrum.

What Ritter found was that there was little change in the silver chloride in the red part of the spectrum, but the compound darkened considerably toward the violet end of the spectrum. Ritter then placed silver chloride in the area just beyond the violet end of the spectrum, in a region where no sunlight was visible. To his amazement, this region showed the most intense darkening of all. This new type of light, which Ritter called "chemical rays", later became known as ultraviolet light or ultraviolet radiation. (The word "ultra" means beyond.)

Hubble Ultra-Deep Field

Hubble Ultra-Deep Field

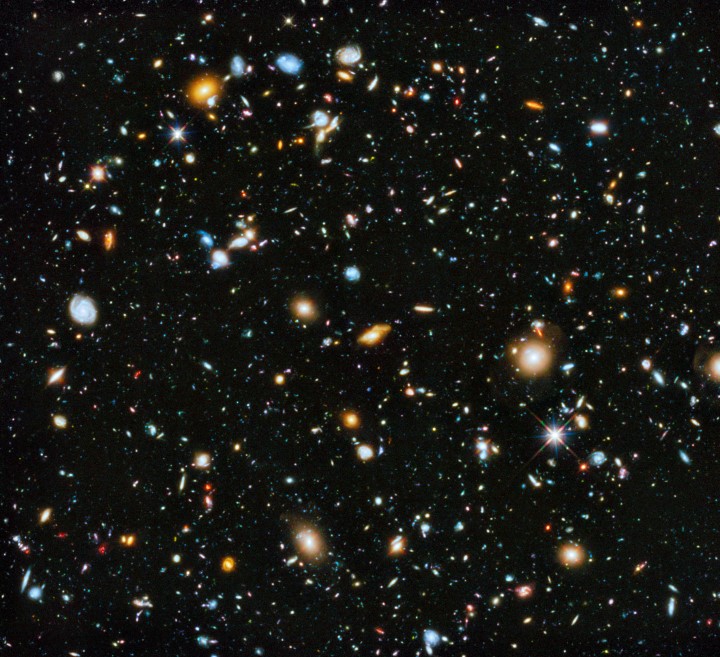
Deep field observations are long-lasting observations of a particular region of the sky. These observations intend to reveal faint objects by collecting light from them for as many as 100 hours at a time. The patch of sky in this image were previously studied by astronomers in a series of visible and near-infrared exposures taken by the Hubble Space Telescope from 2004 to 2009. In 2014, deep field observations in the ultraviolet were added to assemble a comprehensive view of the evolving Universe. With the addition of ultraviolet light, astronomers are able to see the hottest, largest, and youngest stars that lie 5 and 10 billion light-years away Earth, corresponding to a time period when most of the stars in the Universe were born.

Credit: NASA, ESA, H. Teplitz and M. Rafelski (IPAC/Caltech), A. Koekemoer (STScI), R. Windhorst (Arizona State University) and Z. Levay (STScI)

Spectral Lines

So there is light that tells us what stars and planets are made of, but how do scientists get colored lines to tell us what a planet is made of?

The Scottish physicist Thomas Melvill burned different substances and looked at the resulting light through a prism. He saw spectra with different patterns than those seen when daylight passed through a prism. These spectra were not unbroken stretches of color from violet to red, but patches of color. He also saw dark gaps (missing colors) between the patches.

Later the vaporous light was passed through a narrow slit prism. The spectrum of each gas was seen as a set of bright lines of a few definite colors. The colors and locations of these bright lines were different when different substances were put in the flame.

Shining a white light through the gaseous vapor causes some energy to be absorbed by the gas (just like the ray of light travelling to Earth that I described earlier). The dark bands in the spectra show where the energies of those photons were absorbed. The remaining lines of color match up exactly with the energies of the electrons that make up the gaseous elements.

An atmosphere is made of gaseous substances. Scientists discovered that all of the elements making up an atmosphere have a unique signature (or fingerprint). By looking at the spectra of light emitted by a planet's atmosphere, scientists can tell what gases were present when that light began its journey toward the telescope.
Spectra

Spectra

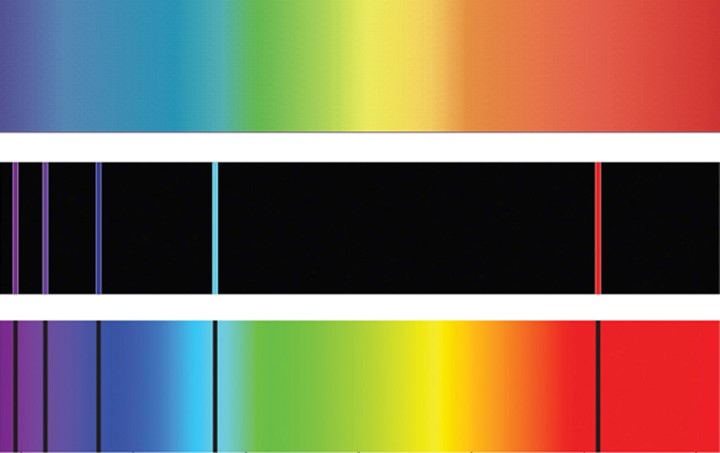
A spectrum is a visual representation of electromagnetic radiation (light) that is produced by a source, for example, a star. This image shows three types of spectra. The top band is a continuous spectrum, which shows the electromagnetic radiation emitted by a source as the result of its temperature. The middle band is an emission spectrum. This type of spectrum shows bright lines at certain wavelengths separated by dark regions where the light has been absorbed. The bottom band is an absorption spectrum, showing dark lines at the wavelengths where light has been absorbed. Because the bright and dark lines are characteristic of certain elements, astronomers can use emission and absorption spectra to determine the composition of stars and interstellar matter.

To study the atmosphere of a planet, astronomers wait until a star or the Sun shines through the atmosphere. They then look at the spectral lines, comparing them to the lines of the known elements. The same thing is done to determine what gases exist in interstellar space, in the space between galaxies, or in the atmospheres of individual stars. The Space Telescope Imaging Spectrograph (STIS) on the Hubble Space Telescope is used to analyze glowing gases of astrophysical objects through a long-slit spectrograph. A diffraction grating is used instead of a prism. The STIS divides the light given off by these gases to reveal the fingerprints of the separate gases.
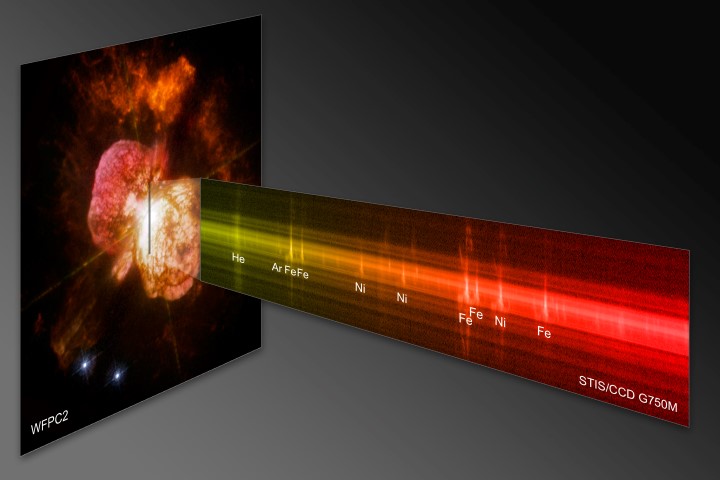
Spectral Analysis of Eta Carinae

Spectral Analysis of Eta Carinae

The Space Telescope Imaging Spectrograph (STIS) on the Hubble Space Telescope analyzed the chemical information along a section of one of the giant plumes of gas from the exploding binary star system, Eta Carinae. In the resulting spectrum, iron (Fe) and nitrogen (Ni) are seen at the outer boundary of the gas cloud coming from Eta Carina A, the primary star. The faint line of argon (Ar) is evidence of an interaction between the gases from Eta Carina A and Eta Carina B, the hotter, less massive, secondary star in the system. The explosion that produced these gas clouds occurred in the mid-19th century.

Credit line here.

Questions

Why is it important to scientists interested in space exploration to know what a planet's atmosphere is made of?
What We Learn From Hubble

The Hubble Space Telescope is one of NASA's most successful and long-lasting science missions. It has beamed hundreds of thousands of images back to Earth, shedding light on many of the great mysteries of astronomy.

Hubble has shown us some of the Universe's earliest galaxies and defined the limits of their age. No telescope before Hubble had the resolution to see these distant galaxies in all their shapes and sizes. Hubble observations have also given scientists clues about the life cycles of stars and galaxies. We have a better understanding of how planetary systems evolve from disks of gas and dust, thanks to Hubble. And Hubble also made the first measurements of the chemical make-up of planet atmospheres, detecting the elements sodium, hydrogen, carbon, and oxygen in the atmosphere of a Jupiter-sized planet. These are just a few examples of what we've learned from Hubble. Light, dust, gas, vapor, elements, stars, planets, atmospheres. Hubble takes pictures of all of these in order to gather data about all that is out there in space. What will it find next?

A Trio of Galaxies

A Trio of Galaxies

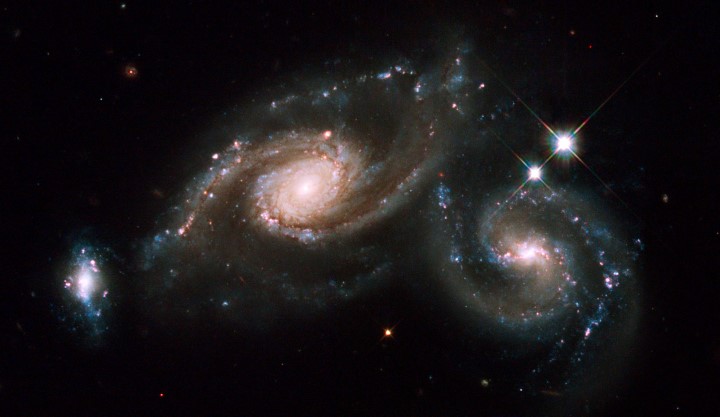
This galaxy system was imaged by the Wide-Field Planetary Camera 2 (WFPC2) on the Hubble Space Telescope. It lies about 400 million light years from Earth, toward the constellation of Virgo. Besides the two large spiral galaxies, a smaller third galaxy is visible on the far left. The three galaxies appear to be partially overlapping, although they may be at somewhat different distances.

The colors in this image reflect the different star populations that make up the galaxies. Yellowish, older stars can be seen around the center of each galaxy, with a bright central cluster of stars in the very middle. Younger, blue stars trace the spiral arms, along with pinkish clouds of dust and gas. Interstellar dust clouds surround the spiral arms of the galaxies, dimming some of the star light.

Credit: NASA, ESA, and M. Livio and the Hubble Heritage Team (STScI/AURA)