

The First Successful Oribiting Astronomical Observatory: OAO-2 operated from 1968 to 1972 and obtained low-resolution UV spectra and broad-band photometric observations of many classes of astronomical objects. The 2012 kg satellite is shown here in a clean room at the Goddard Space Flight Center. The panels on the two sides of the main body of the satellite are the solar panels that power the system. The telescopes are mounted inside the cylindrical structure. For scale, compare the size of the observatory to the persons in clean suits in the lower right of the image.
Credit: NASA
After my year with the Stratoscope II project, I came to the University of Wisconsin, Madison because Professors Arthur Code, Robert Bless, and Ted Houck were involved with flying UV experiments on sounding rockets and they offered me a job. In addition, they were actively pursuing the building of the first of the Orbiting Astronomical Observatories (OAO), a series of UV astronomical observatories NASA decided to create in late 1958, only one year after the launch of Sputnik.
It is noteworthy that the OAO series (A, B, and C) was actually started six years before the first moderate-resolution UV spectra of stars were obtained with small spectrographs flown on sounding rockets, and before it was known how to successfully make pointing and control systems operate in the space environment.
OAO-A, containing UV instruments from Wisconsin and X-ray instruments from MIT, was launched in 1966 and renamed OAO-1 after its successful launch. However, no scientific data were obtained because of a high voltage failure. The proper control of high voltages in the low-pressure space environment has always been a difficult problem. Since back up components existed for the OAO-A mission, NASA decided to fly the Wisconsin experiment again along with a UV imaging instrument from the Smithsonian Astrophysical Observatory. This mission was successfully launched on December 7, 1968, becoming OAO-2. The launch occurred three months after I arrived in Madison. What excellent timing! I immediately became involved with a flood of new observations of the Universe in the previously inaccessible UV band of the spectrum.

OAO-2 Low-resolution Digital UV Spectrum of Two Hot Stars: Ultraviolet flux is plotted against wavelength in Å for two hot stars with aproximately the same temperature of 30,000 K. The scale on the left is for zeta (ζ) Ophiuchi and the scale to the right is for mu (μ) Columbae. The very different shapes of these two spectra is caused by the effects of interstellar extinction produced by dust grains in space. The two stars have the same intrinsic spectrum, but ζ Ophiuchi is behind a dust cloud and μ Columbae is not. The dust produces the dip in the ζ Ophiuchi spectrum at 2200 Å.
Credit: Spectrum courtesy Blair Savage / University of Wisconsin OAO-2 Data Archive / NASA
The OAO-2 Wisconsin experiment contained broad-band UV photometers and low-resolution spectrum scanners. Over its four-year lifetime OAO-2 provided broad-band observations of approximately 1100 UV emitting stars and low-resolution UV spectra of approximately 330 stars. As a young member of the OAO-2 science analysis team, I marveled that OAO-2 had begun to produce a steady stream of high-quality UV observations of hot stars, cool stars and other astronomical objects, including exploding stars, globular clusters, planets, comets, and several galaxies.
Based on my introduction to interstellar science and UV spectroscopy at Princeton, I immediately started to use the OAO-2 spectroscopic observations to study the UV extinction produced by dust in the ISM and the distribution of interstellar atomic hydrogen through the very strong Lyman alpha absorption line at 1216 Å.
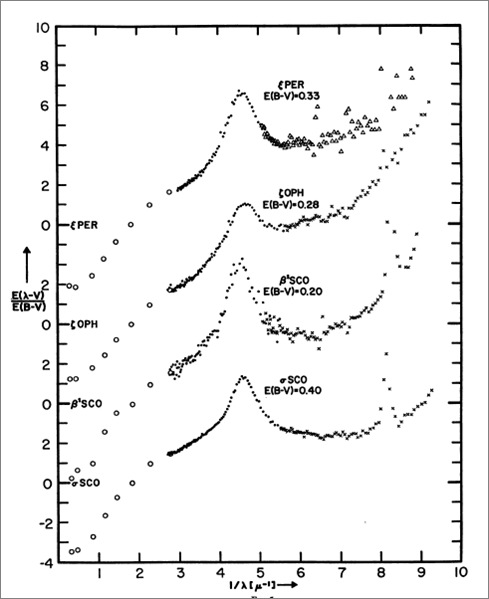
Interstellar Dust Spectra: The spectra of dust along four lines of sight with the spectrum of the background star itself subtracted is shown. The bump noted in the earlier figure appears here near 4.7 on the x-axis as a rise instead of a dip. The figure shows that the bump is a characteristic of interstellar dust it is not unique to the one star, ζ Ophiuchi. The nature of the dust is unknown and the origin of the bump is unknown. For more information about this spectra, see Bless, T. C., Savage, B. D. 1972, ApJ, 171, 293.
Credit: Courtesy Blair Savage and Reproduced by Permission of the AAS
With the great success of OAO-2, everyone was very excited about the launch of the more capable OAO-B, which contained a 0.9-meter mirror feeding light a moderate-resolution spectrum scanner operating from 1050 to 4300 Å with a spectral resolution ranging from 2 to 64 Å. The instrument was developed by a science team at the Goddard Space Flight Center. Unfortunately the 1970 launch of OAO-B failed to achieve orbit because one-half of the launch vehicle nose cone failed to eject. This was a major loss to the young field of UV spectroscopy.
