
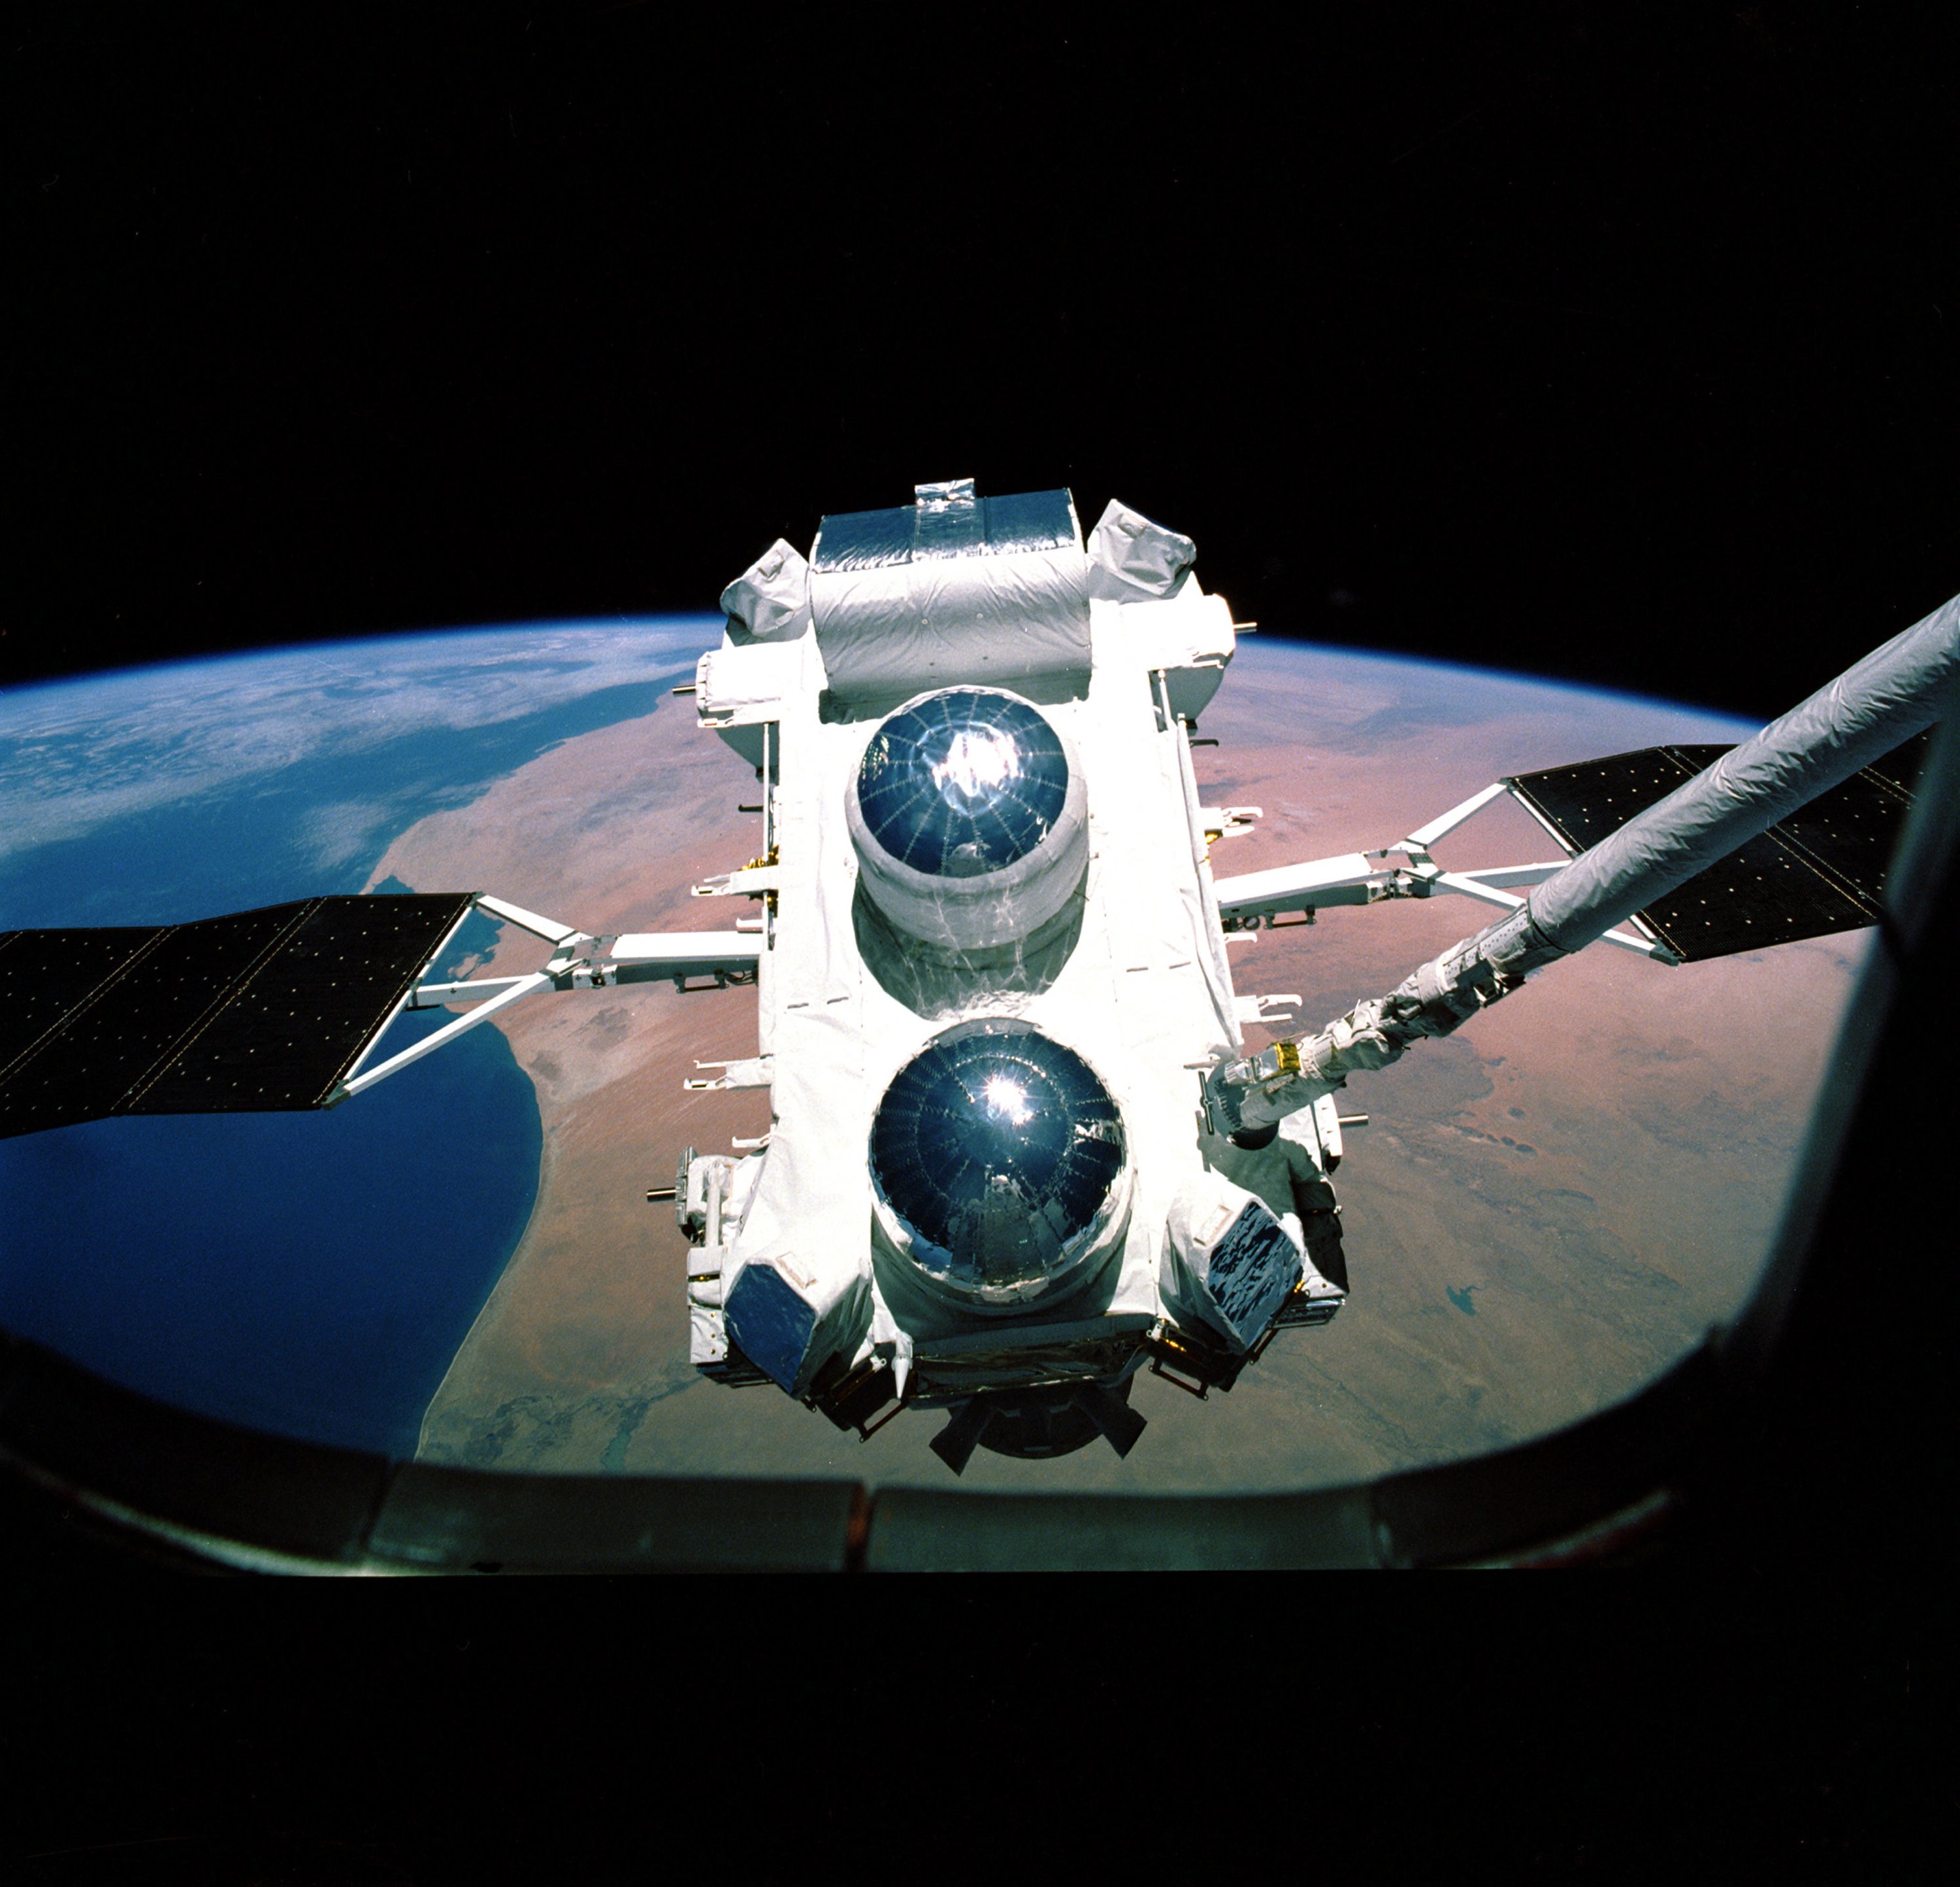
Compton Gamma Ray Observatory being released from the Shuttle: The Compton Gamma Ray Observatory was launched into orbit aboard the space shuttle Atlantis in April 1991. The photograph was taken by a member of the shuttle crew through a window on the Atlantis shuttle as the astronauts use the shuttle arm to release the observatory into orbit. The Earth is visible in the background.
Credit: NASA/MSFC
When I got into the field there wasn't much interest in GRBs, and there were only a few instruments capable of observing them. So when Jerry Fishman contacted me in 1985 and asked me to work for NASA's Marshall Space Flight Center in Huntsville, Alabama, it was a turning point in my life.
Jerry and the people here in Huntsville designed and built an instrument dedicated to burst detections to fly on the Compton Gamma-Ray Observatory. In 1991, the Burst and Transient Source Experiment—BATSE was launched from the space shuttle Atlantis. With BATSE the data started coming and it was a watershed—every day a discovery. Those were very exciting and wonderful times!
BATSE confirmed more than 2,700 GRBs and showed that they come from all over the sky, strongly suggesting they are explosions occurring in distant galaxies. It also showed that GRBs seem to occur in two types: long--greater than two seconds, and short--less than two seconds. (This is one of the major contributions I've made to this field. I established the existence of this type of distribution.)
BATSE allowed astronomers to monitor the distribution of the GRBs across the sky. It was soon clear that they are detected at a rate of about one per day, from all directions. But where were they coming from? The Compton Observatory could “see” the GRBs, but couldn’t pinpoint their source.
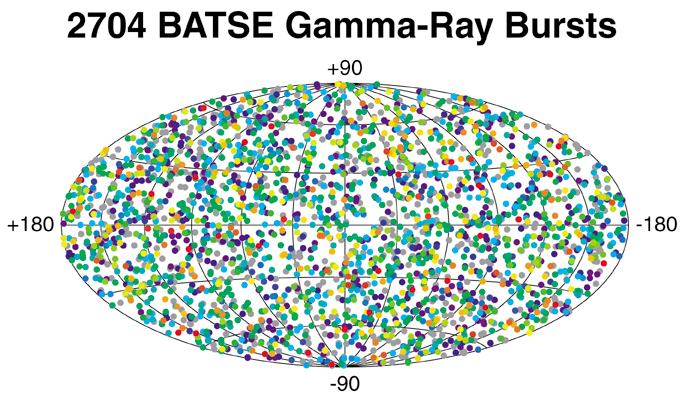
BATSE GRB distribution map: Each dot on the elliptical surface of this map represents the location of one of 2704 gamma-ray bursts detected by BATSE during its 9-year mission. The map’s perspective places the plane of the Milky Way horizontally across the map, with the Galactic Center at the center of the map. The bursts are color-coordinated according to intensity with long, intense bursts colored red, and short, weaker bursts colored purple. Note that the majority of the bursts are colored green, which denotes medium energy and/or duration.
Credit: NASA/MSFC
