
Not all nebulae are galaxies; some have completely different spectra than do the galaxies. Instead of looking like stars, they show only a few bright, narrow lines of pure red, blue, or green color from a continuous background. The specific way the emission occurs is complicated, but the net result is that photons from the exciting star cause this specific type of emission, which only occurs in the proximity of hot stars. Each of the pure colors can be specifically identified with a certain type of atom or ion. Nothing about the emission resembles a star. This type of nebula, called an emission nebula, can occur in our Galaxy or any other galaxy with hot stars.
As a specific example, consider hydrogen, the most abundant element in the Universe, which is widely spread throughout the Milky Way Galaxy. When a hot star illuminates nearby hydrogen atoms, starlight is absorbed by the hydrogen. The result is to produce a glowing gas with a spectrum of pure red, green, and blue emission lines in a pattern easily recognizable as hydrogen gas.
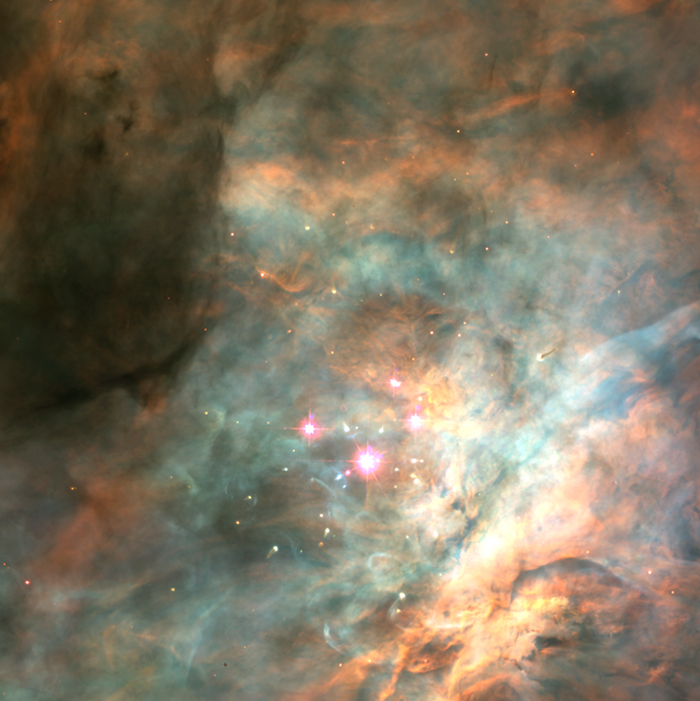
The Orion Nebula's Trapezium Cluster: Hubble Space Telescope image of the Orion Nebula. The Trapezium is the set of four optically visible stars at the core of the nebula.
Credit: NASA, C.R. O'Dell and S.K. Wong (Rice University)
Now, I said the process of emission is complicated. Unlike in stars, the hydrogen gas in emission nebulae does not shine because it is very hot. When a hydrogen atom in the nebula is in the path of a high-energy photon from the nearby star, the photon is absorbed by the atom, exciting an electron to a higher state. When the electron reaches this high-energy state, its natural tendency is to lose the energy as fast as possible by releasing new photons. However, an electron in an atom can only have specific energies that depend on the type of atom of which it is a part. So to release its energy, the atom has to emit unique wavelengths of light. Hydrogen, and every other element, shine in their own unique way by emitting a characteristic spectrum, like a unique shade of color identifying the element, and we are able to tell what elements make up an object in space by looking at the wavelengths of light that our detectors receive.

Spectrum of a Small Portion of the Orion Nebula Gas: The emission lines are part of the Balmer series of hydrogen, near 3680 Å. Note the series convergence to shorter wavelengths. The absorption spectrum of Merope, the reflection nebula, shows lines from the same hydrogen series. The nebular emission arises when stellar photons (from very hot stars) ionize the hydrogen gas. When the resulting electrons and protons recombine, the emission spectrum appears. It is obviously easy for an astronomer to distinguish a reflection nebula from and emission nebulae using their spectra, even though they may both look similar in some images. The spectrum was obtained with the Ultraviolet Visual Echelle Spectrograph on one of the four 8.5 meter telescopes called the Very Large Telescope (this particular one named Kueyen), in Chile. The spectrum took about 600 seconds to record. For more information about this spectrum, see Esteban, C, et al. 2004, MNRAS, 355, 229.
Credit: Courtesy of the Monthly Notices of the Royal Astronomical Society
