
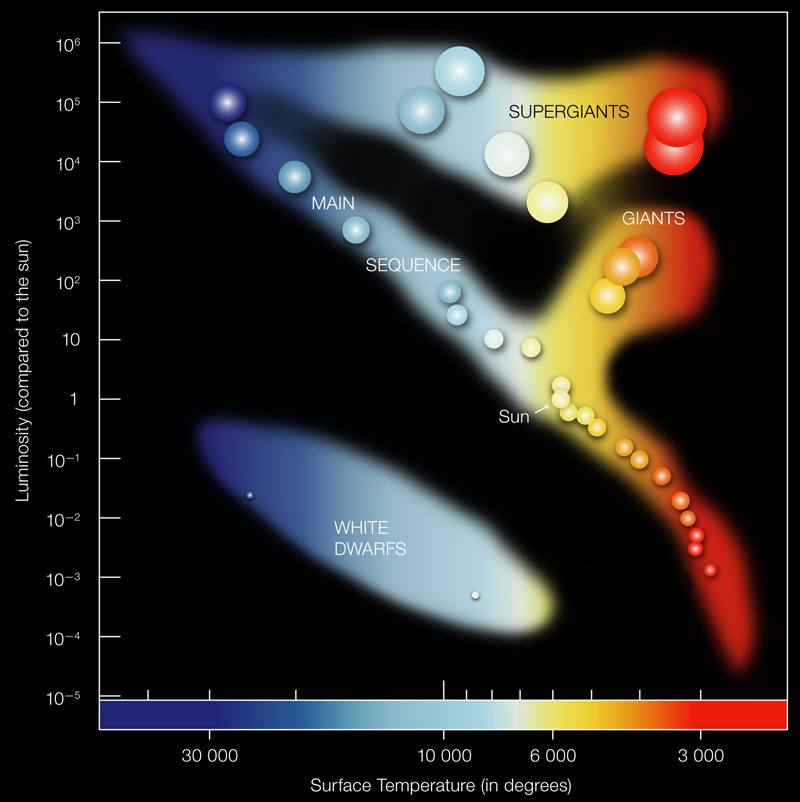
Major Branches on the H-R Diagram: The H-R diagram is an important astronomical tool for understanding how stars evolve over time. Stellar evolution can not be studied by observing individual stars as most changes occur over millions and billions of years. Astrophysicists observe numerous stars at various stages in their evolutionary history to determine their changing properties and probable evolutionary tracks across the H-R diagram. When the absolute magnitude (MV) – intrinsic brightness – of stars is plotted against their surface temperature (stellar classification) the stars are not randomly distributed on the graph but are mostly restricted to a few well-defined regions. The stars within the same regions share a common set of characteristics. As the physical characteristics of a star change over its evolutionary history, its position on the H-R diagram changes also – so the H-R diagram can also be thought of as a graphical plot of stellar evolution. From the location of a star on the diagram, its luminosity, spectral type, color, temperature, mass, age, chemical composition and evolutionary history are known. the Cepheid varibles used by Hubble are in the region labelled as "Supergiants". Astronomers see them as having a certain apparent magnitude in a given galaxy, know their absolute magnitude and hence can determine their distances. Thus, were the distances to the first galaxies determined.
Credit: NASA/CXC/SAO
With an HR diagram at hand, I could determine the absolute magnitude of a star from its star type. Stars of the same temperature may have different radii, hence, different absolute luminosities. The spectral types had to be modified based on the pattern seen in the HR diagram. At a given temperature, five zones in absolute magnitude could be defined and labelled (faintest to brightest) as V, IV, III, II, Ia, Ib. This added detail could also be determined from the spectrum.
It was discovered by Henrietta Leavitt, from Harvard University, that stars in a certain part of the HR diagram were variable stars. From their spectral types, I could determine their absolute luminosities. The stars are called Cepheid variables. These stars can be seen in other galaxies, which are far away from Earth. Thus, the stars are faint and it is difficult to obtain the spectrum, normally required for getting the absolute luminosity. However, the Cepheid variables are so distinctive by their variability that we can effectively determine the absolute luminosity without a spectrum: we just need a series of images to define the variability. Furthermore, they are among the brightest of stars, so, while apparently faint, they can be seen at great distances.
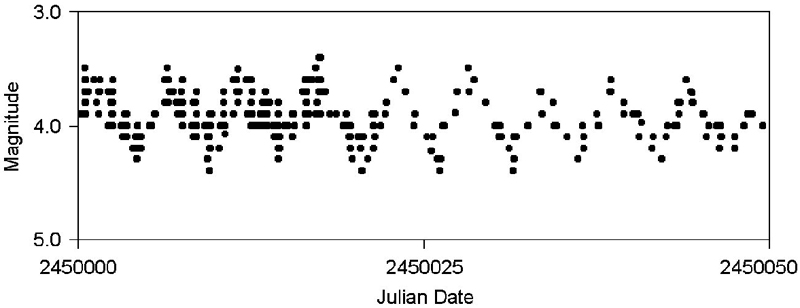
Cepheid Light Curve: Cepheid variable stars expand and contract in a repeating cycle of size changes. The change in size can be observed as a change in apparent brightness (apparent magnitude.) Cepheids have a repeating cycle of change that is periodic - as regular as the beating of a heart, with a period of 1 to 70 days with an amplitude variation of 0.1 to 2.0 magnitudes.
Credit: NASA/CXC/SAO
