
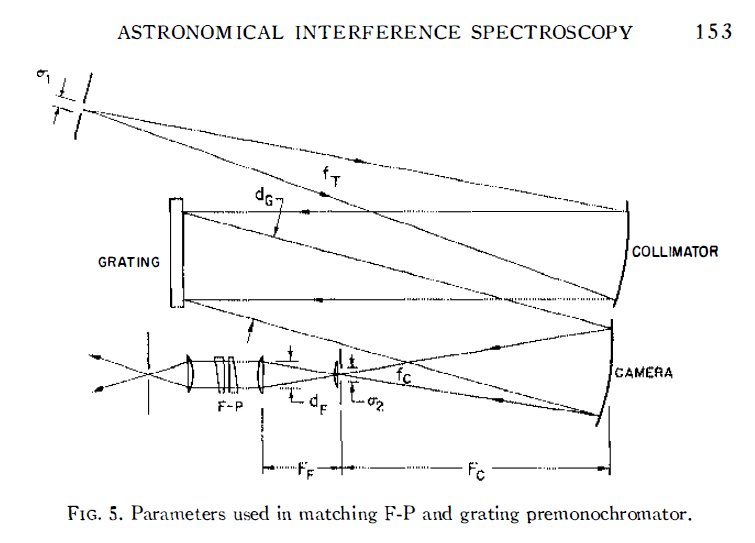
Interferometer: This diagram shows an optical system similar to what Nick Woolf constructed at Lick Observatory. Light from the telescope is focused onto a slit at the top left. The light is collimated and sent to a grating. The dispersed light is focused into a spectrum by the camera. A section of the spectrum then enters the chain of optics at the lower right. The small section of the spectrum is again collimated, and fed as a parallel beam to a set of very flat parallel plates, called a Fabry-Perot interferometer. This device boosts the resolving power of the input spectrum to reveal more detail about the astronomical target. The output is focused onto a detector for measurement. For more information about this diagram, see Vaughan, Arthur H. 1967, ARA&A, 5, 139.
Credit: Image courtesy Annual Review of Astronomy and Astrophysics
The interferometer that I built at Lick was able to see the spectral lines, but it wasn’t doing appreciably better than people had been doing before by taking very long exposures with photographic plates. I didn’t have enough background to know that there was a particular set of observations of interstellar cyanogen (CN) I should have made to repeat what had been done in the 1930s, and that would have been extremely important. I realized that only substantially later, and it’s part of the continuing story. I'll come to that later. What actually happened and was important was that while I was using my optics to do one kind of work, I was continually being pulled into other interesting astronomical topics.
As I was doing my work with this interferometer, somebody noticed that there was an interesting paper by Jan Oort, from Holland, on globular star clusters. Since I was one of the younger people at the observatory, I was asked, “Would you read up on this and give us a talk on what the paper’s all about?” Now, the paper was about stellar dynamics, a field in which I’d had no background whatsoever before, and I had to learn the field in two weeks! After I understood the paper, I found that there was an important set of observations that could be made at Lick Observatory and I managed to persuade George Herbig to help and to make some new observations for the work.
In this case the observations related to matter being ejected from stars. Nowadays we understand that many stars eject up to 85% of their initial matter before they end their nuclear reactions, but in those days, it was thought that stars largely retained their matter. Gravitational interactions among the stars can change the typical positions of stars within the cluster, depending on their mass. Heavier stars would sink to the center, lighter stars would be thrown to the outside. If there were no mass loss, the distributions should have been the same, but the appearance of the locations of stars as a function of age within the tightly bound clusters implied that stars were losing substantial amounts of mass (becoming lighter) as they aged. But, in old star clusters, the older stars seemed to be found selectively at the edge of the clusters, compared to slightly younger stars.
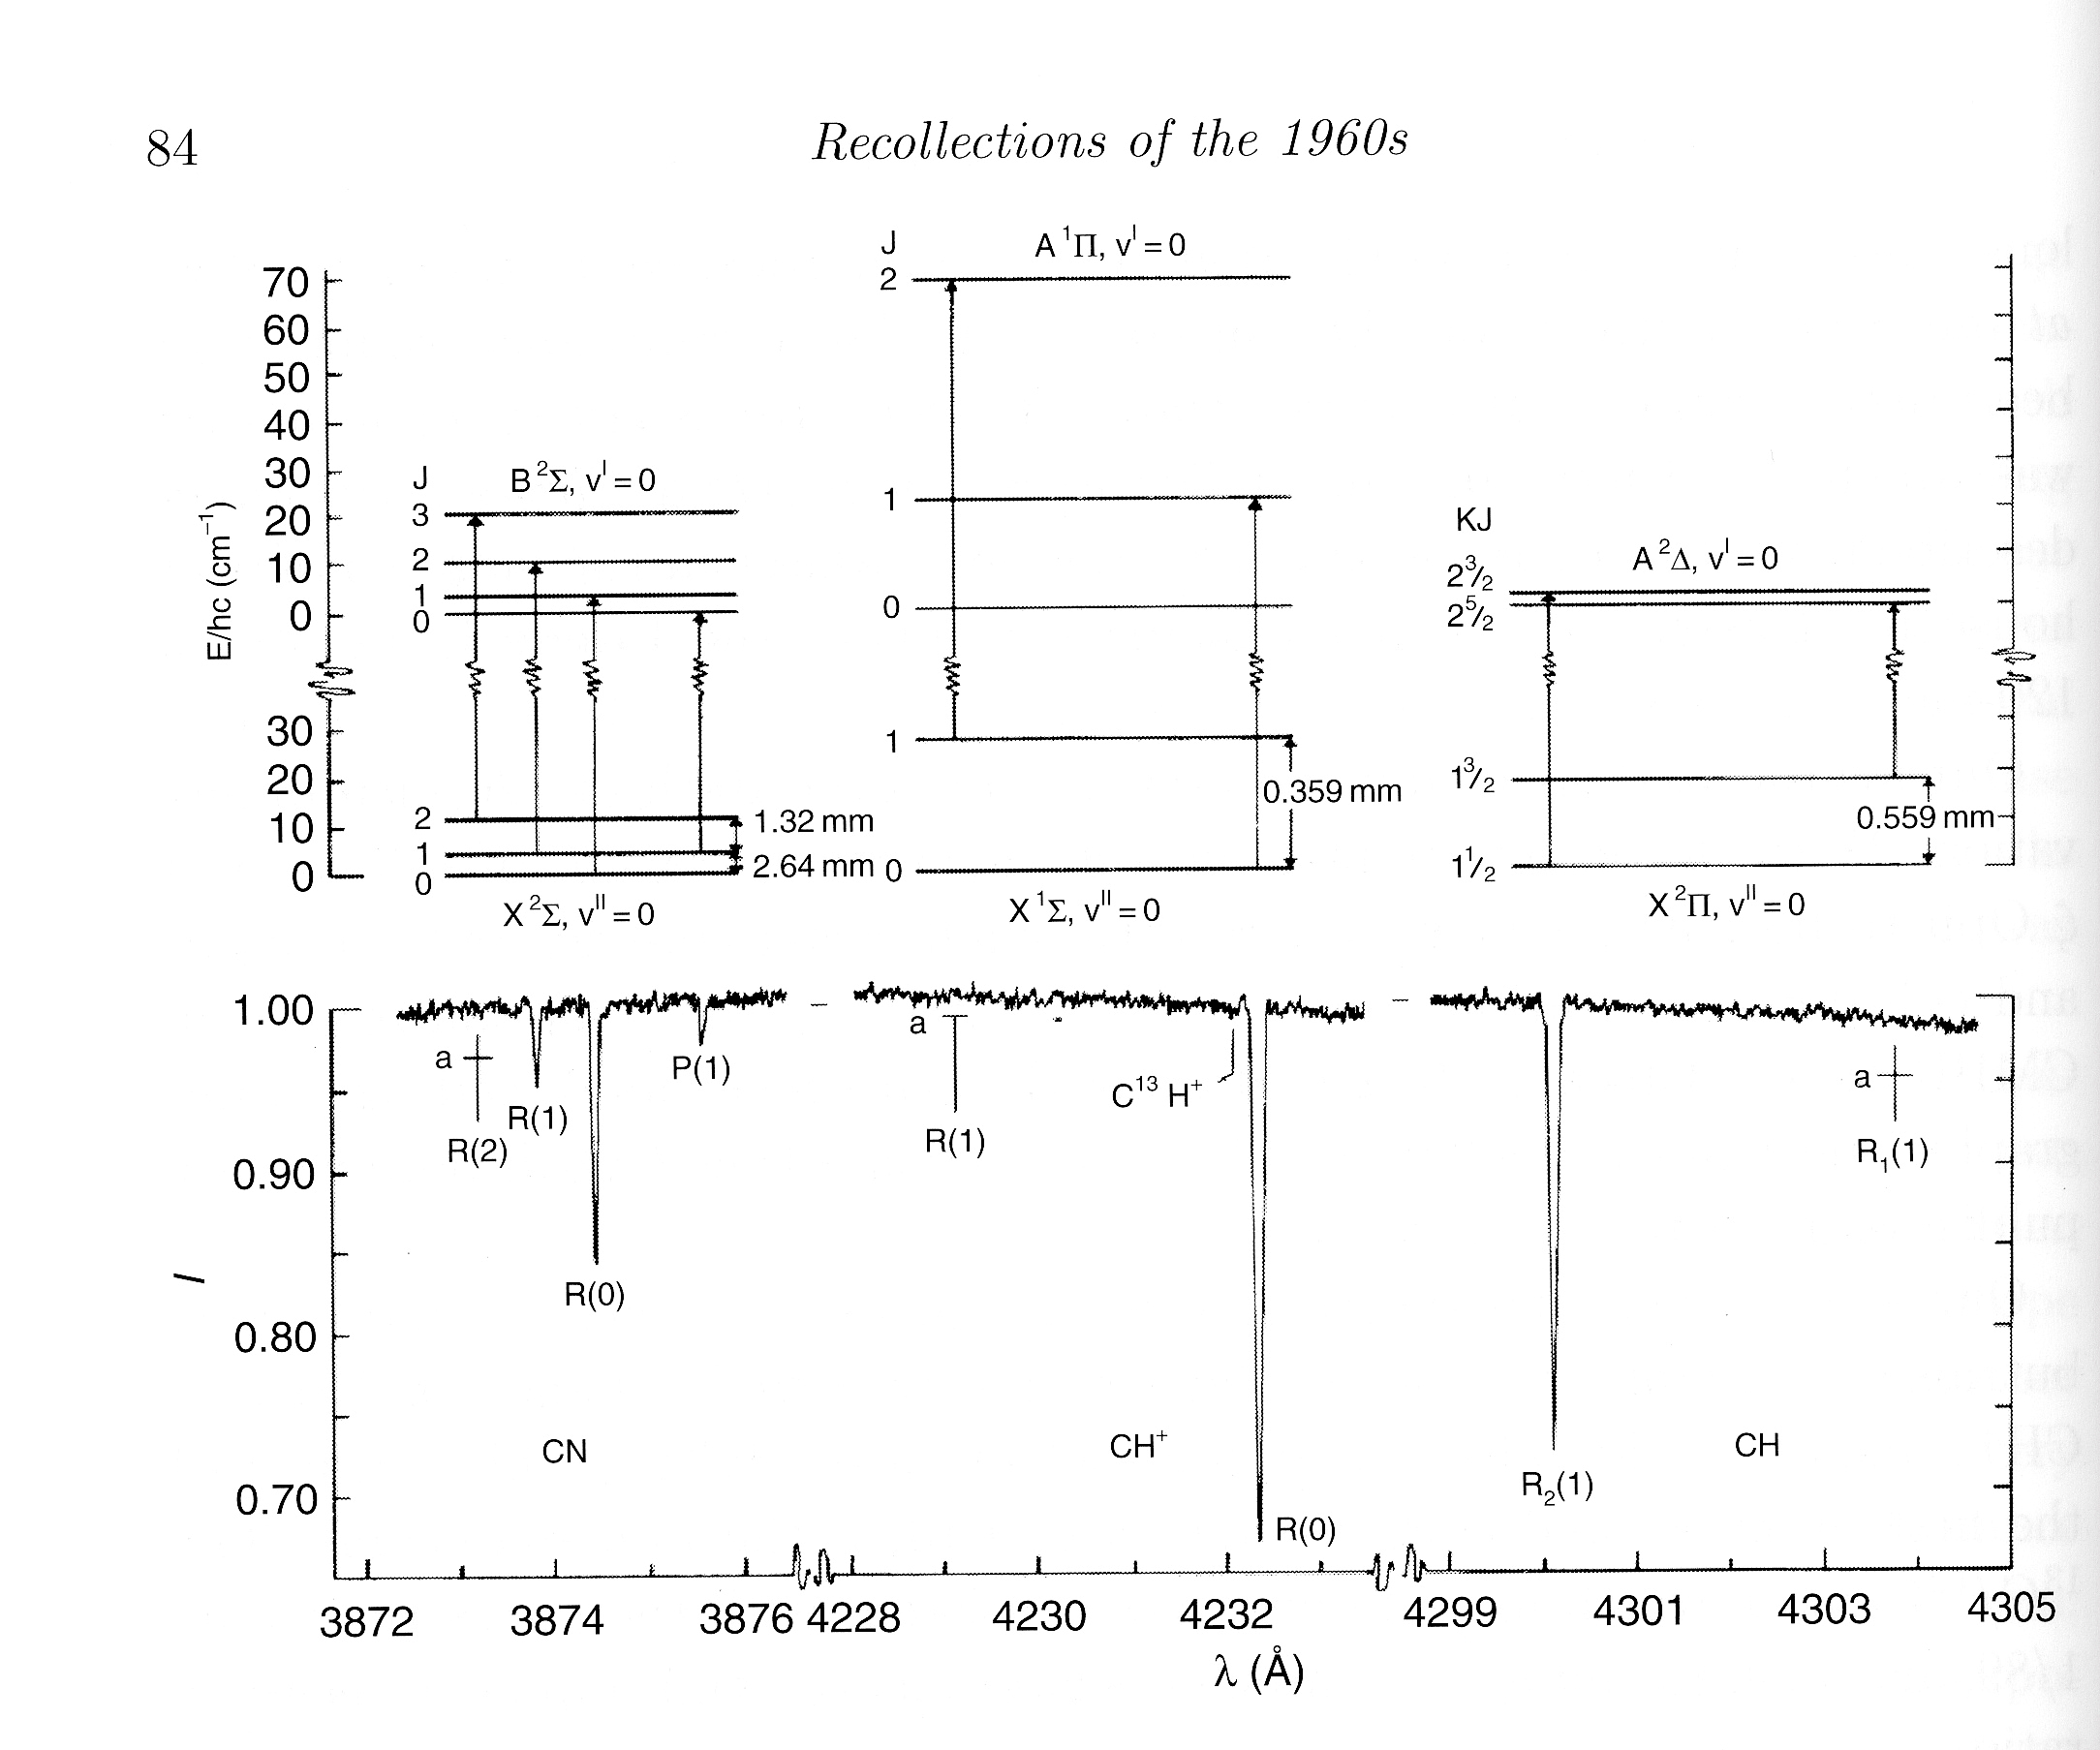
Spectroscopy of Interstellar Absorption Lines: Spectra of interstellar molecules observed using a conventional spectrograph at Lick Observatory in 1968. The top panels show schematicaly the energy levels in the molecules CN, CH, and CH+ respectively. The lower panels show tracings of the spectrum of the absorption lines from the molecules in the spectrum of the star zeta (ζ) Ophiuchi. The spectrum of CN in the lower left corner has llines labeled R(1) and P(1) which are caused by the cosmic microwave background radiation, the echo of the Big Bang. These are the two lines that, on reflection, Nick Woolf would have observed if he had known about them. For more information about these spectra, see Bortolet, V. I., Thaddeus, P., and Clauser, J. P. 1969, Phys. Rev. Let., 22, 307.
Credit: American Physical Society
