
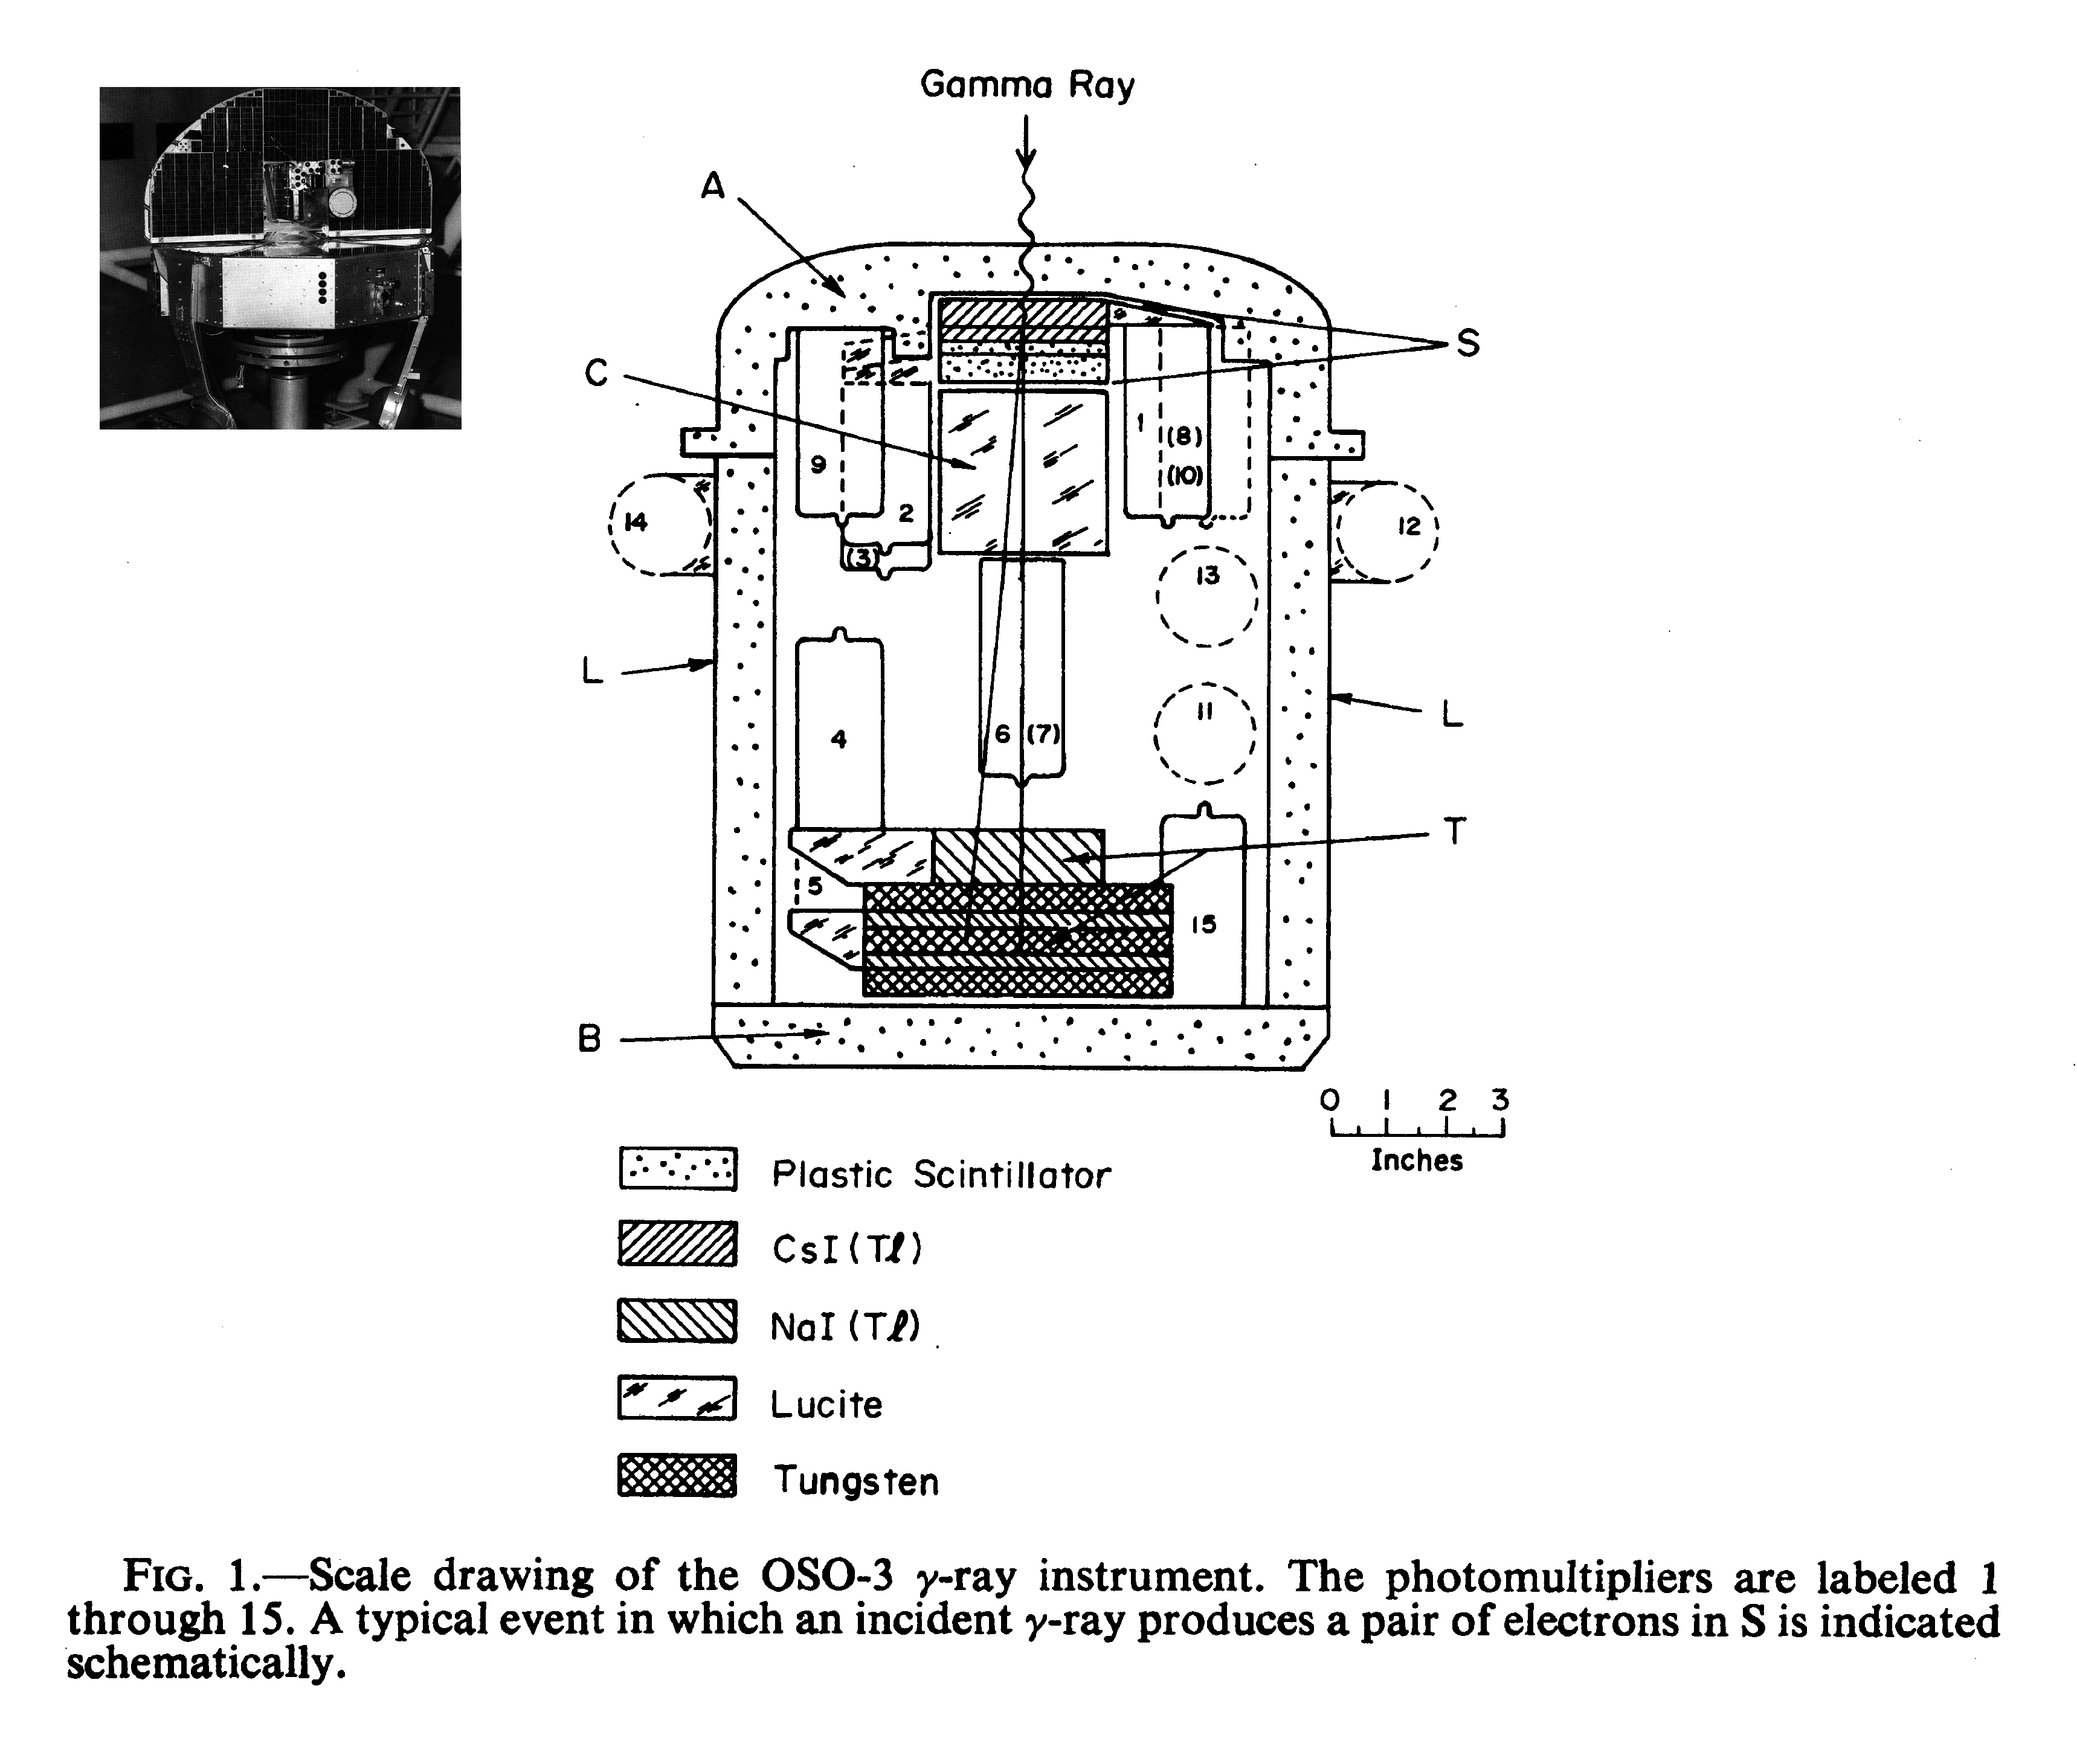
OSO 3 Detector: Scale drawing of the OSO 3 detector. Inset is a picture of the satellite.
Credit: George Clark; NASA
Now joined by Gordon Garmire, we developed an improved gamma-ray telescope. The new detector was placed in the wheel section of the third Orbiting Solar Observatory, OSO 3, and launched in 1967. This time we obtained 621 gamma-ray signature events that showed a clear concentration of arrival directions from the Milky Way, which proved that we had detected cosmic gamma rays with energies above 50 MeV. We also found a component of gamma rays from unresolved extragalactic sources that showed a different distribution of energy than those coming from the Milky Way. The discovery of the galactic and extragalactic components of cosmic gamma rays was soon confirmed by results from other investigators with ever more capable gamma-ray observatories, culminating most recently in the Fermi Gamma-ray Space Telescope with which hundreds of discreet galactic and extragalactic sources of high-energy gamma rays are being studied.
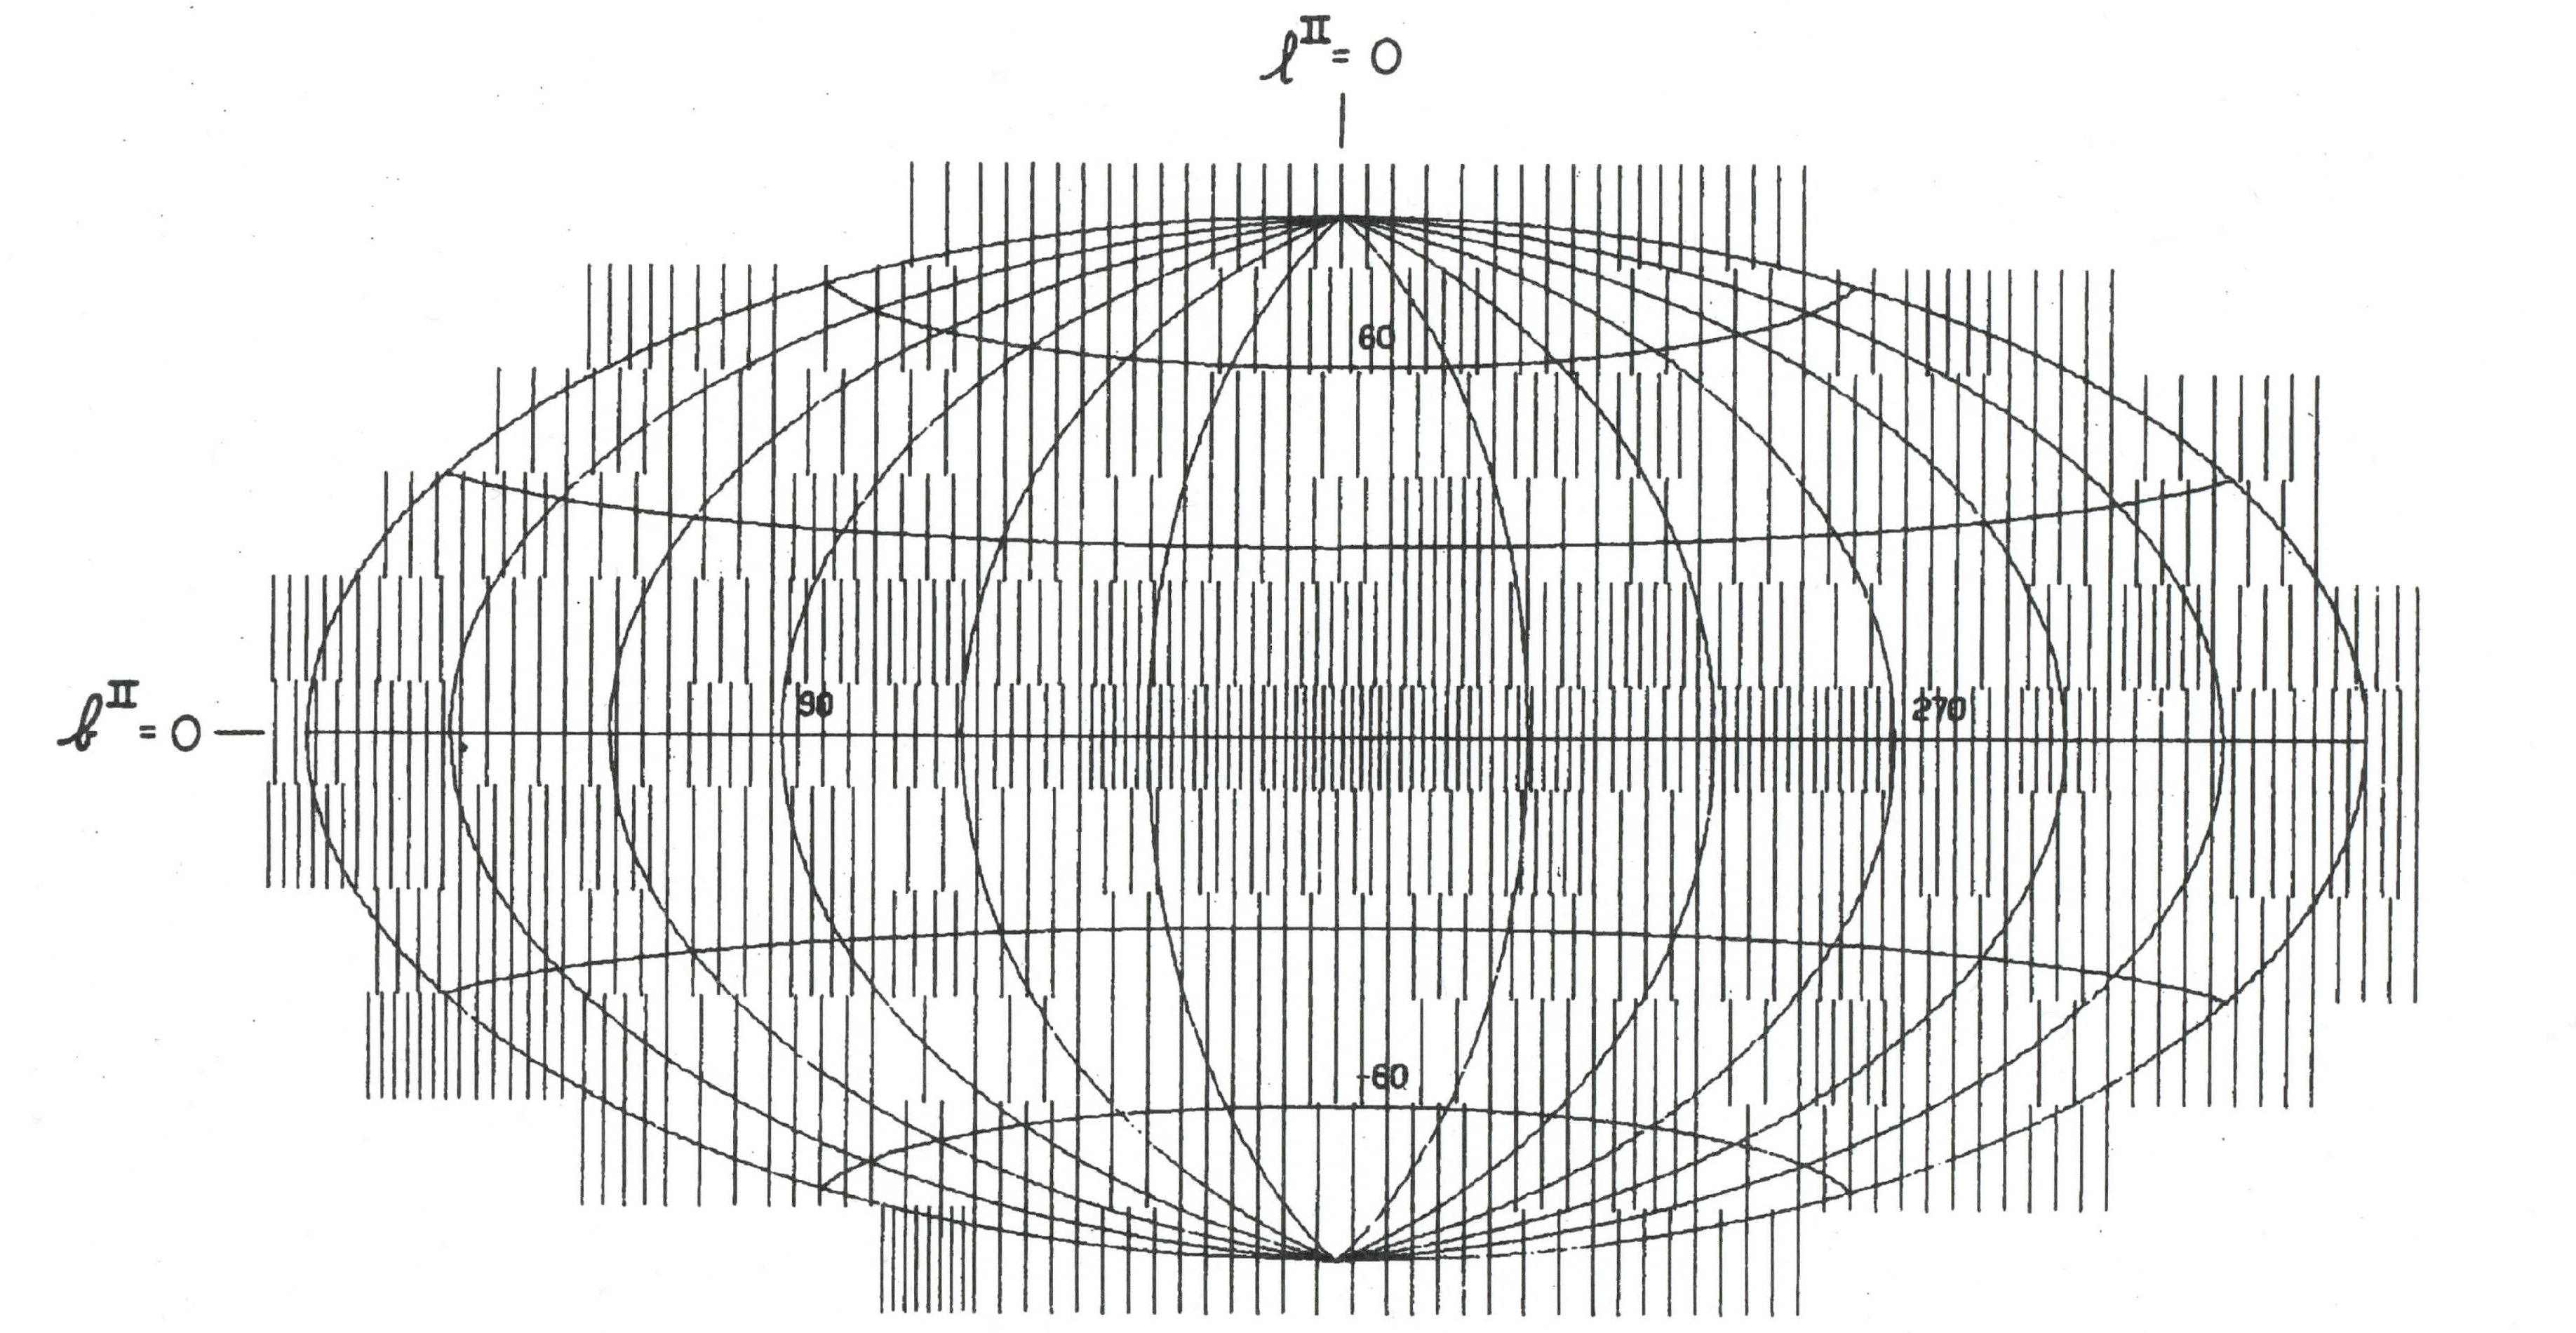
Gamma Ray Discovery Map: A gamma-ray discovery map, made with the data from Clark and Kraushaar’s 1967 OSO 3 experiment. The number of gamma-ray events recorded per solid angle on the sky is indicated by the density of vertical lines. The map illustrates the crucial concentration of events toward the center, which is the center line of the Milky Way.
Credit: ©American Astronomical Society
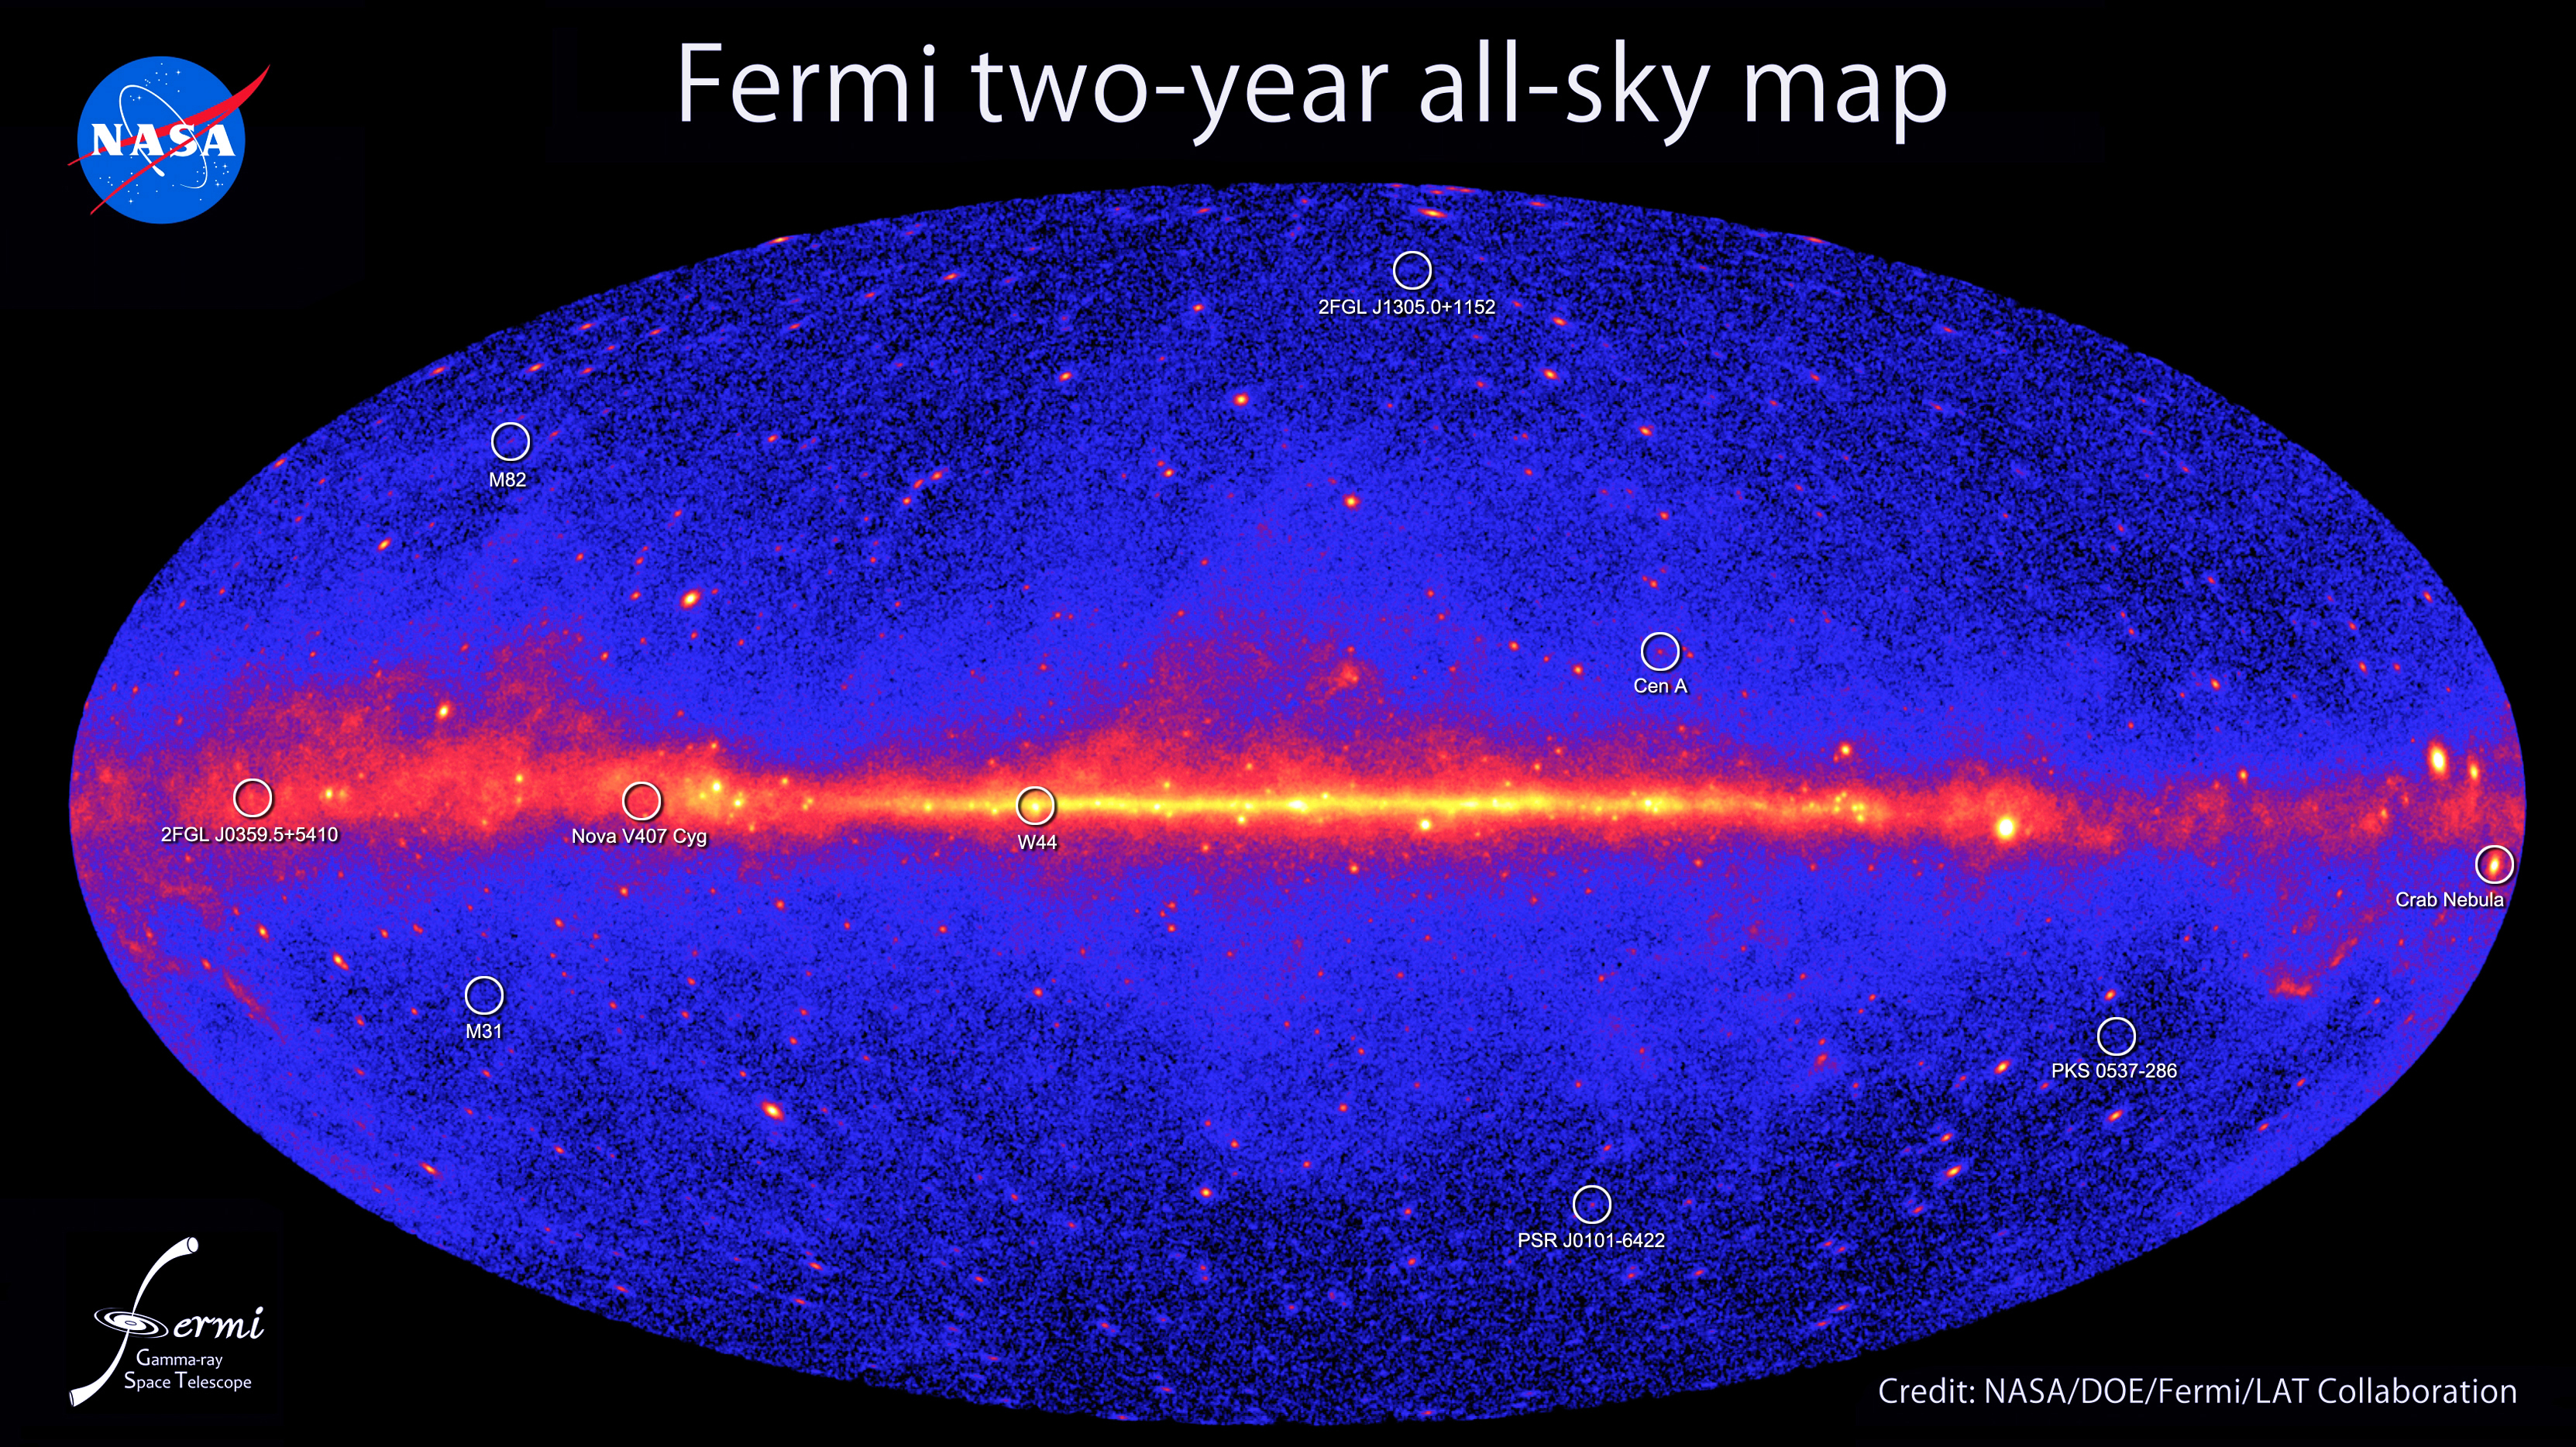
Gamma Ray Sky Map: This all-sky image made in 2011 was constructed using two years of observations by NASA's Fermi Gamma-ray Space Telescope. It shows how the sky appears at energies greater than 1 billion electron volts (1 GeV). Brighter colors indicate brighter gamma-ray sources. A diffuse glow fills the sky and is brightest along the plane of our Galaxy (middle). Discrete gamma-ray sources include pulsars and supernova remnants within our Galaxy, as well as distant galaxies powered by supermassive black holes.
Credit: NASA/DOE/Fermi LAT Collaboration
