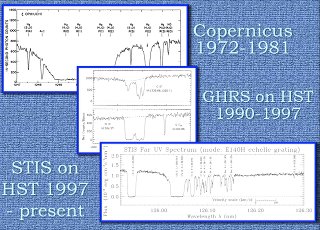
Three Spectra: Ultraviolet spectra from Copernicus (top), the High Resolution Spectrograph (HRS) (center) on the Hubble Space Telescope, and the Space Telescope Imaging Spectrograph (bottom), which replaced the HRS on Hubble. The x-axis on the top spectrum is wavelength in Ångstroms. The x-axis on the center spectrum is velocity offset in km/sec (about 210 km/sec per Ångstrom). The x-axis on the bottom spectrum is wavelength in nanometers (126.00 nm equals 1260 Ångstroms).
Credit: Courtesy Ed Jenkins
Copernicus was one of the first orbiting ultraviolet spectrographs. (Unlike many other missions, that one did not have an abbreviation!) However, Copernicus could only look at stars not too far from the Sun. It was limited to stars of about 5th or 6th magnitude, only about as faint as the human eye could see.
IUE allowed people to look at stars of 10th magnitude, 11th magnitude, a hundred times fainter than those observable with Copernicus. That allowed you to look further into space, sampling a larger volume of the gas between the stars. You could also view outside of the galaxy and start studying quasars. Interstellar gas looks similar independent of the brightness of the object, but looking at the brightest objects gives you the highest quality information. Anything that's really, really bright in the ultraviolet is what we want to look at: hot stars; massive stars; white dwarfs; quasars; and exploding stars, like supernovae.
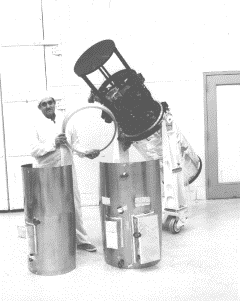
IUE Spectrograph Assembly: A technician displays the shroud and support rings used to cover the spectrograph assembly, raised above the telescope tube. The tube has been partially covered with mylar thermal insulation, and the sunshade has been removed.
Credit: NASA / GSFC / STScI
Then the next big advance really was the Hubble Space Telescope in 1990. There were two ultraviolet spectrographs installed on the telescope: the Faint Object Spectrograph (FOS) and the High Resolution Spectrograph (HRS). We used both spectrographs to study quasars, which are among the brightest objects in the Universe. Because quasars are so intrinsically bright, a quasar is typically 100,000,000 times brighter than a star, they allow us to look to the greatest distance and to study the gas in between the galaxies, intergalactic gas rather than interstellar gas. Intergalactic gas has been one of my interests ever since. I found it interesting from a theoretical standpoint. The ability to sample larger volumes of space than were possible with IUE gave both new and more information about the gases between the galaxies. With Hubble we could go to point sources, stars or quasars, of apparent 15th magnitude, which is a factor of one hundred times fainter than we could go with IUE. A change of five astronomical magnitudes is a factor of one hundred in brightness.


