
Spectroscopy is at the heart of astrophysical inference. So, the Cosmic Origins Spectrograph actually gives us a spectrum, a graph that looks like a bunch of squiggly lines. And that's where all the information is! It is not really in the beautiful images that have become synonymous with Hubble. If you really want to find the information embedded in the light and infer what's going on astrophysically, you need spectroscopy. You need the images, too. They go hand in hand, but we rely on the spectra to tell the story and explain the images. It's really the story that drives the science.
Take, for instance, the spectrum of a quasar: every one of the big peaks comes from a different element. There's hydrogen (H), helium (He), oxygen (O), silicon (Si), iron (Fe), neon (Ne), nitrogen (N), and carbon (C). Everything underneath is probably non-thermal radiation coming from either a jet or a disk around a black hole. If you blow it up really close you get more squiggly lines-- all of the little sharp features are narrow absorption lines from intervening intergalactic gas between the quasar and the Earth observer.
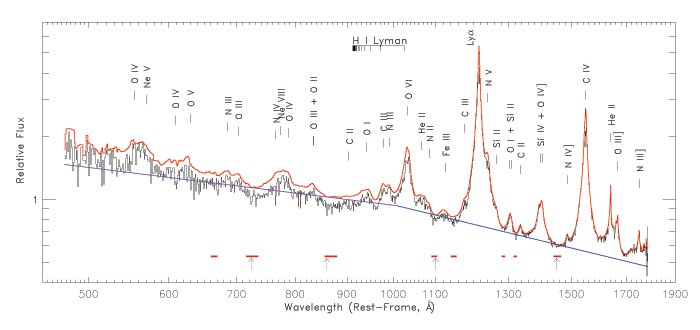
Composite Spectra of 159 AGNs: Each peak is labelled with the type of atom or ion that creates that particular feature on a spectrum.
Credit: Image courtesy J. Michael Shull