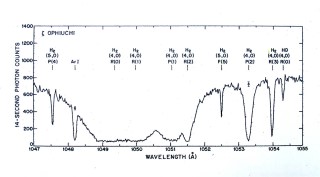
Copernicus (OAO-3) High-resolution Observation of Very Strong Molecular Hydrogen Absorption in the Spectrum of the Zeta (ζ) Ophiuchi: ζ Ophiuchi is situated beyond a strongly absorbing interstellar cloud of gas and dust. The detector count rate is plotted against the ultraviolet wavelength, in Å, over the short wavelength range from 1047 to 1055 Å. Very strong absorption features (dips) are due to molecular hydrogen, molecular hydrogen , in the interstellar cloud in front of ζ Ophiuchi. The various molecular hydrogen lines measure the molecule in different rotationally excited states. The molecular hydrogen absorption is so strong it implies that 68% of the hydrogen in the cloud toward the star is in the form of the molecule with the rest being atomic hydrogen. Cold molecular hydrogen in the interstellar gas can only be studied at UV wavelengths. For more information about this spectrum, see Spitzer, L., Jenkins, E. B. 1975, ARA&A, 13, 133. Spectrum originally published in Morton, D.C.. 1975, ApJ, 197, 85.
Credit: Courtesy Ed Jenkins and the American Physical Society
The last of the OAOs, OAO-C, was launched in 1972 becoming OAO-3. Its name was soon changed to the Copernicus satellite. The satellite contained a telescope with an 0.8-meter mirror followed by a very high-resolution UV spectrometer operating from 912 to 1450 Å and from 1650 to 3000 Å. This Princeton University project was led by Lyman Spitzer. The Copernicus satellite operated until 1982 and produced a wealth of information about the physical state of the ISM and about the mass outflow from hot stars.
Two scientific highlights of the Copernicus mission include the first comprehensive assessment of the physical state and distribution of molecular hydrogen (H2) in the ISM. H2 has very strong absorption lines at far UV wavelengths between 912 and 1100 Å. The only way to study H2 in the cold ISM is through its UV absorption. In addition to studying very cold gas in the ISM, the Copernicus satellite revealed the presence of hot gas in the ISM through the presence of very strong absorption of five-times ionized oxygen (O+5), which has absorption lines at 1031.9 and 1037.6 Å.
Although most of the observations obtained by the Copernicus satellite were analyzed and interpreted by Princeton University astronomers, NASA began to require that observations obtained with their expensive satellites be made available to astronomers not formally involved with the design and building of the satellite. NASA thereby created what are now referred to as guest observer programs where other astronomers can propose observational programs and, if the programs are accepted, gain access to observations coming from the satellite observatories. I benefited from such a program and with Ralph Bohlin pursued a major survey of interstellar atomic and molecular hydrogen. I thereby moved from doing low-resolution UV spectroscopy with OAO-2 to very high-resolution spectroscopy with the Copernicus satellite.
While the OAO program of satellites greatly advanced the field of ultraviolet space astronomy, they had significant observational limitations. Their detectors of UV radiation were simple photomultiplier tubes that were only able to record the UV photons in a single spectral resolution element at a time. In the case of the Copernicus satellite, the far UV spectrograph provided access to 800 Å of the UV spectrum but the detector recorded only 0.05 Å of that spectrum at a time. To obtain the entire spectrum required 16,000 separate 14-second exposures. A complete spectrum took three days. Complete spectra were only obtained for several bright stars. For most scientific programs spectroscopic information was only obtained for very narrow spectral ranges. For example, the range from 1031 to 1033 Å was used to study the important O+5 absorption line at 1031.9 Å. In general, the detectors on the early satellites were extremely inefficient for recording complete UV spectra. Therefore, OAO-2 and OAO-3 were limited to only observing the brightest UV-emitting stars. In order to have further advances in UV astronomy it was necessary to develop UV area detectors with large multiplexing advantages that could operate successfully in the space environment.


